RSI MACD Crossover Double MA Tracking Strategy

Author: ChaoZhang, Date: 2023-10-23 17:00:44
Tags:

img

Overview

This strategy combines RSI indicator, MACD indicator and double moving averages to achieve trend tracking and positioning effects in volatility market. It uses RSI indicator to judge overbought and oversold conditions, MACD to determine entry and exit points with fast and slow MA crossover, and double MAs to filter out some noisy trading opportunities during the trend.

Strategy Logic

  1. Calculate RSI indicator for overbought and oversold
  • Calculate price change uptrend and downtrend

  • Compute RSI based on the price change

  • Determine overbought and oversold levels

  1. Calculate MACD for crossover
  • Compute fast MA, slow MA and signal line

  • Enter long on golden cross and exit on death cross

  • Plot the crossover situations

  1. Implement double MA filter
  • Compute fast and slow moving averages

  • Only consider trading when fast MA crosses above slow MA

  • Filter noise and follow the trend

  1. Combine indicators for entry
  • Filter entry signal with RSI, MACD and double MA

  • Improve accuracy and stability of strategy

Advantage Analysis

  • Combination of multiple indicators improves accuracy

  • Trend following filters noise and enhances stability

  • RSI spots potential reversal points

  • MACD crossover provides simple entry and exit signals

  • Double MA removes most countertrend trades

  • Easy to understand with few parameters, good for learning

Risk Analysis

  • Risk of overfitting with multiple indicators

  • Double MA sacrifices flexibility and may miss chances

  • RSI and MACD parameters need careful selection

  • Pay attention to stop loss based on symbol

  • Requires periodic re-tuning of parameters

Optimization Directions

  • Adjust RSI parameters for different symbols

  • Optimize double MA periods for better tracking

  • Add stop loss to control single trade loss

  • Incorporate more indicators to enrich combo

  • Develop adaptive parameter model for auto-tuning

Summary

This strategy combines RSI, MACD and double MA to identify and track trends, and filters signals through multiple layers. It is very suitable for beginners to learn and improve. The advantage lies in its simplicity and adaptiveness. Fine tuning of parameters can generate decent steady returns. Next steps may include adding more indicators, developing adaptive parameter model to auto optimize for different market environments.
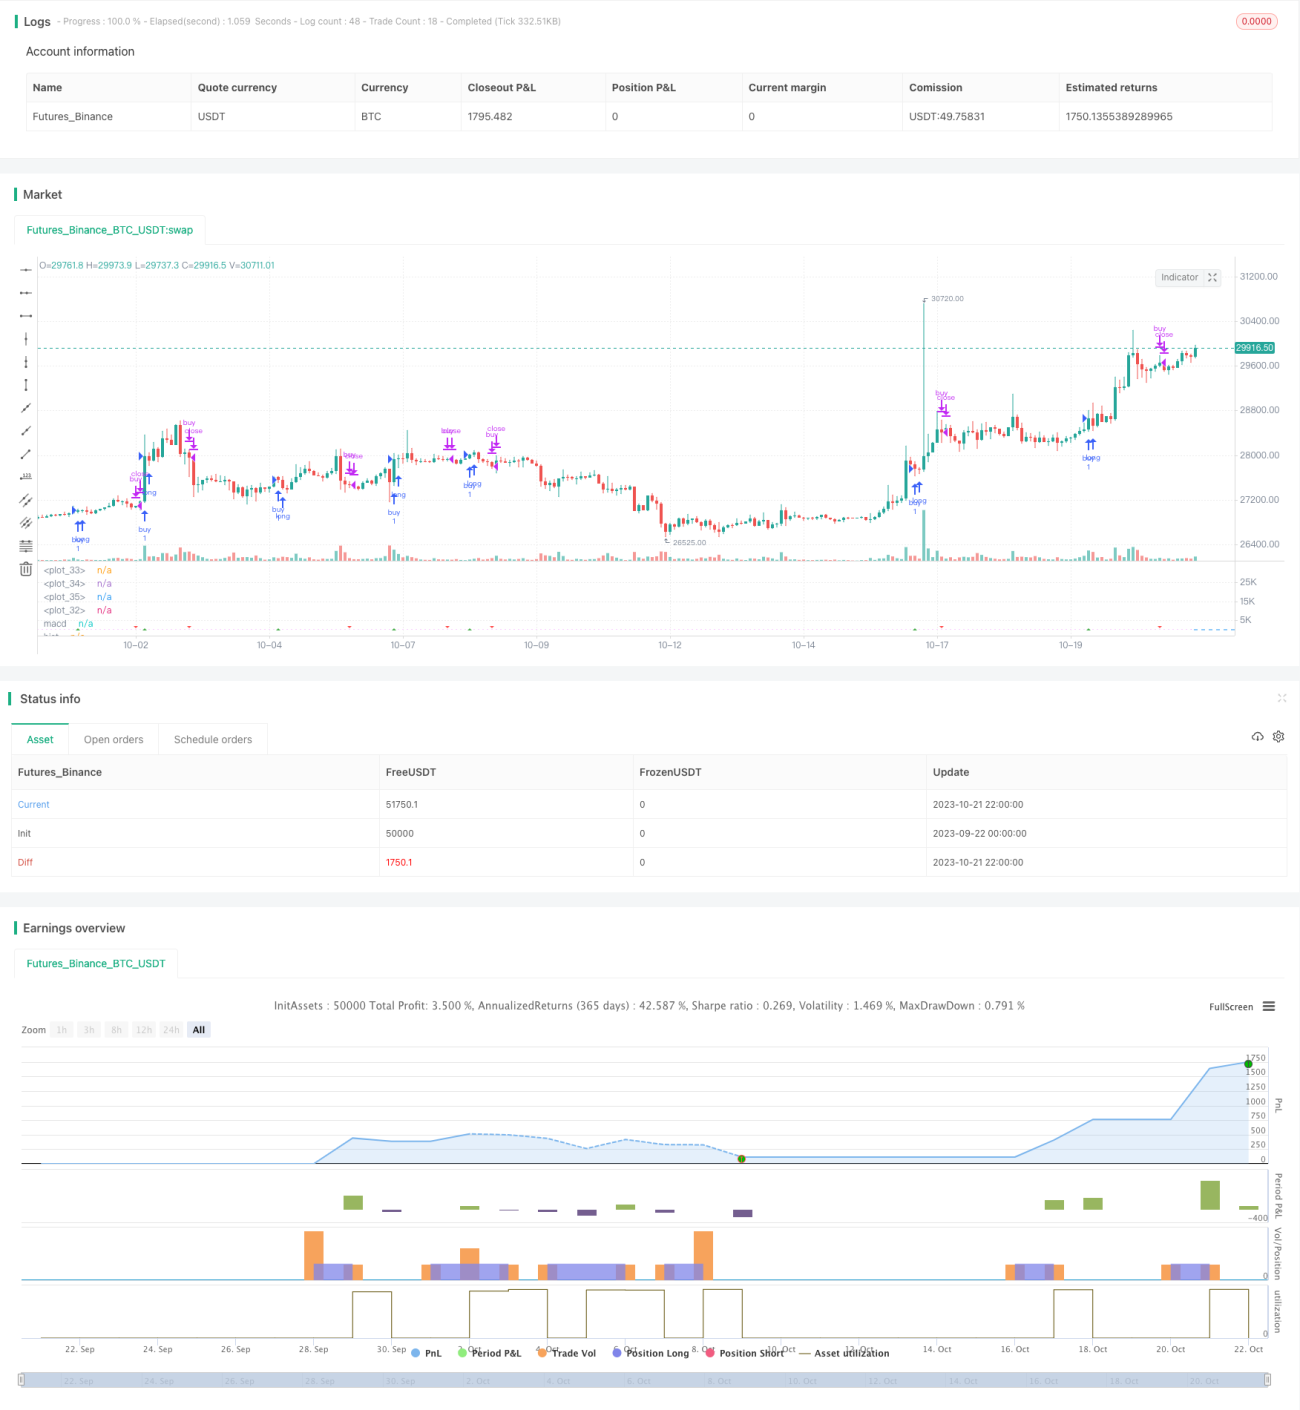

/*backtest
start: 2023-09-22 00:00:00
end: 2023-10-22 00:00:00
period: 2h
basePeriod: 15m
exchanges: [{"eid":"Futures_Binance","currency":"BTC_USDT"}]
*/

//@version=3

// strategy(title="RSI MACD", precision = 6, pyramiding = 1, default_qty_type = strategy.percent_of_equity, default_qty_value = 99, commission_type = strategy.commission.percent, commission_value = 0.25, initial_capital = 1000)

// Component Code Start
// Example usage:
// if testPeriod()
//   strategy.entry("LE", strategy.long)
testStartYear = input(2017, "Backtest Start Year")
testStartMonth = input(01, "Backtest Start Month")
testStartDay = input(2, "Backtest Start Day")
testPeriodStart = timestamp(testStartYear,testStartMonth,testStartDay,0,0)

testStopYear = input(2019, "Backtest Stop Year")
testStopMonth = input(7, "Backtest Stop Month")
testStopDay = input(30, "Backtest Stop Day")
testPeriodStop = timestamp(testStopYear,testStopMonth,testStopDay,0,0)

// A switch to control background coloring of the test period
testPeriodBackground = input(title="Color Background?", type=bool, defval=true)
testPeriodBackgroundColor = testPeriodBackground and (time >= testPeriodStart) and (time <= testPeriodStop) ? #00FF00 : na
bgcolor(testPeriodBackgroundColor, transp=97)

testPeriod() => true
// Component Code Stop

//standard rsi template
src = ohlc4, len = input(14, minval=1, title="Length")
up = rma(max(change(src), 0), len)
down = rma(-min(change(src), 0), len)
rsi = down == 0 ? 100 : up == 0 ? 0 : 100 - (100 / (1 + up / down))
plot(rsi, color=#87ff1a)
band1 = hline(80)
band = hline(50)
band0 = hline(20)
fill(band1, band0, color=purple, transp=90)

//macd

fast_length = input(title="Fast Length",  defval=9)
slow_length = input(title="Slow Length",  defval=72)
signal_length = input(title="Signal Length",  defval=9)

fast_ma = sma(rsi, fast_length) 
slow_ma = sma(rsi, slow_length) 
shortma = sma(ohlc4, fast_length)
longma = sma(ohlc4, slow_length)
controlmainput = input(title = "Control MA", defval = 234)
controlma = sma(ohlc4, controlmainput)
macdx = fast_ma - slow_ma
signalx = sma(macdx, signal_length)
hist = macdx - signalx
ma_hist = shortma - controlma
macd = macdx + 50
signal = signalx + 50

plot(macd,"macd", color = fuchsia)
plot(hist,"hist", style = histogram, color = fuchsia)
//plot(ma_hist,"ma hist", style = histogram, color = orange)
plot(signal,"signal", color = white)

//input
control_buy_toggle = input(true, "Buy on crossover control MA?", type = bool)
buy_on_control = control_buy_toggle == true? true : false

//conditions
buy = buy_on_control == true? ma_hist > 0 and shortma > longma and crossover(macd,signal) or crossover(shortma, controlma) : ma_hist > 0 and shortma > longma and crossover(macd,signal)
sell = ma_hist > 0 and shortma > longma and crossunder(macd,signal)
stop = crossunder(shortma, longma) or crossunder(shortma, controlma)

plotshape(buy,"buy", shape.triangleup, location.bottom, green, size = size.tiny)
plotshape(sell,"sell", shape.triangledown, location.bottom, red, size = size.tiny)
plotshape(stop,"stop",shape.circle,location.bottom, white, size = size.tiny)

if testPeriod()
    strategy.entry("buy", true, when = buy, limit = close)
    strategy.close("buy", when = sell)
    strategy.close("buy", when = stop)


More