Trend Following Strategy Based on Moving Average Crossover

Overview
This strategy mainly uses the golden cross and dead cross of moving averages and candlestick breakthrough of moving averages to make long and short decisions. It goes long when the short period moving average crosses over the longer period moving average, and goes short when the short period moving average crosses below the longer period moving average. Candlestick close price breaking through the moving average is also used as the entry signal.
Principles
-
Calculate two moving averages, EMA1 and EMA2, with different periods. EMA1 has a shorter period and EMA2 has a longer period.
-
Determine if EMA1 crosses over EMA2, if yes, go long.
-
Determine if EMA1 crosses below EMA2, if yes, go short.
-
Determine if the closing price breaks through EMA1 as the entry signal.
-
Exit mechanism: set fixed stop loss or use Donchian Channel to set stop loss.
Main functions used:
- ema(): calculate exponential moving average
- crossover(): determine if EMA1 crosses over EMA2
- crossunder(): determine if EMA1 crosses below EMA2
- rising()/falling(): determine if price is rising or falling
- valuewhen(): return different values based on condition
Advantages
-
Simple logic, easy to understand and implement.
-
Utilize the trend following trait of moving averages to effectively track trends.
-
Combining candlestick close price breakthrough helps avoid false breakthroughs.
-
Flexible usage of different moving average combinations adaptable to different periods.
-
Stop loss mechanism controls risk.
Risks
-
Frequent golden crosses and dead crosses during market consolidation cause whipsaws.
-
Fixed stop loss points may be too rigid to adjust based on market changes.
-
Moving averages lag and may miss reversal signals at turning points.
-
Precise judgment of moving average slope needed to filter false breakthroughs.
-
Parameter selection needs caution, inappropriate frequency or lagging may affect strategy performance.
Optimization
-
MACD zero line crossover can help determine trends and filter consolidations.
-
Add Donchian Channel for dynamic stop loss line to improve fixed stop loss.
-
Add Bollinger Bands to judge strong or weak trends, avoiding ineffective trading during market consolidations.
-
Optimize moving average parameter combinations and test actual performance of different period strategies.
-
Consider adding anchored moving averages to reduce lag.
Conclusion
The overall logic of this strategy is simple and clear, utilizing classic moving average crossover trading techniques, and combining candlestick breakout for entry to effectively filter false signals. Optimization spaces include using other indicators for trend strength, dynamic stops etc. In general, trend following strategies based on moving averages are classic and intuitive, with valuable exploration spaces for optimization.
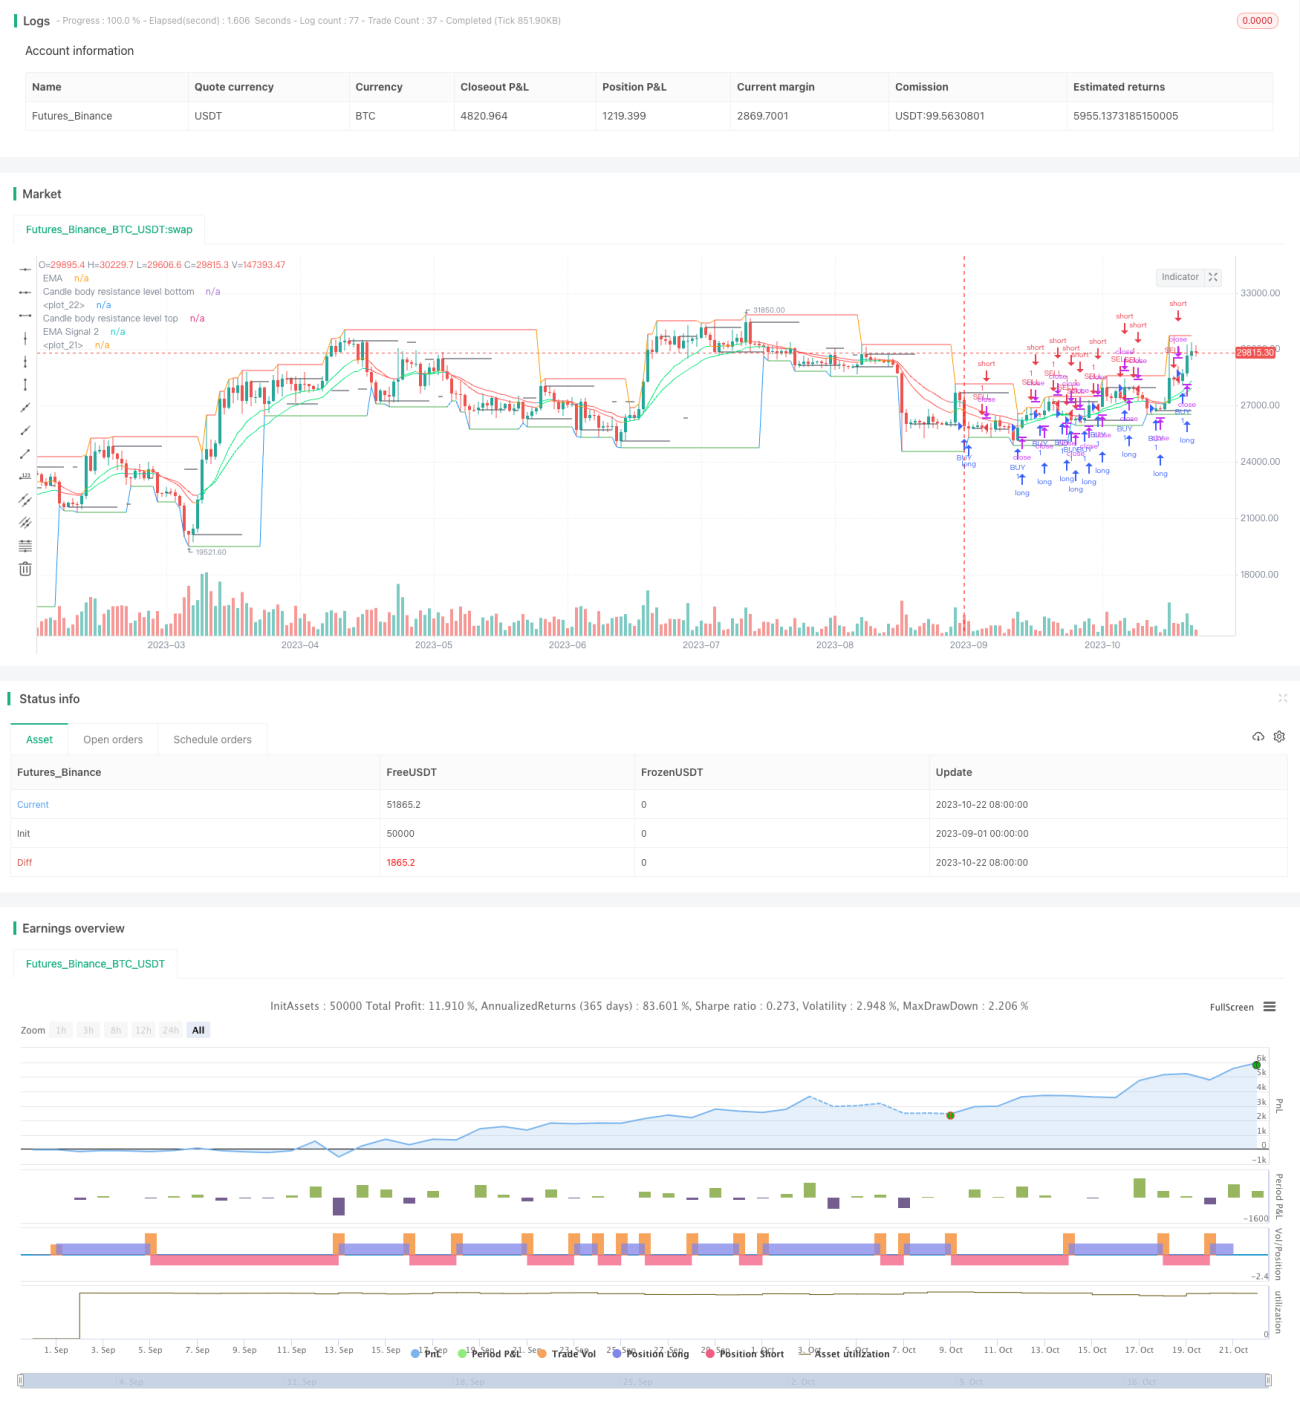
/*backtest
start: 2023-09-01 00:00:00
end: 2023-10-23 00:00:00
period: 1d
basePeriod: 1h
exchanges: [{"eid":"Futures_Binance","currency":"BTC_USDT"}]
*/

//@version=2
strategy(title='Mega crypto bot strategy', shorttitle='megacryptobot_Strategy', overlay=true, pyramiding=0, initial_capital=10000, currency=currency.USD)

//Candle body resistance Channel-----------------------------//- 1