Moving Average Tracking Stop Loss Strategy

Author: ChaoZhang, Date: 2023-10-24 11:21:57
Tags:

img

Overview

The core idea of this strategy is to design an automated trading system that can profit in trending markets while controlling drawdowns by using moving averages and a trailing stop loss mechanism.

Strategy Logic

  1. The strategy allows users to choose from various types of moving averages, including simple moving average, exponential moving average, weighted moving average, etc. Users can select the moving average type based on their preferences.

  2. Users need to set the period of the moving average. Generally the period is between 20-60 for medium-term trading.

  3. Once the moving average is chosen, the strategy will calculate it in real-time. It will go long when price breaks above the moving average and go short when price breaks below the moving average.

  4. The strategy uses a trailing stop loss mechanism. After opening a position, it will continuously monitor the relationship between the moving average and price, and dynamically adjust the stop loss level. Specifically, the stop loss is set at the moving average plus/minus a stop loss percentage set by the user.

  5. Users can set the stop loss percentage. A larger percentage means a wider stop loss range and less sensitivity. A smaller percentage means a tighter stop loss and lower risk. The stop loss percentage is generally set between 2%-5%.

  6. After opening a position, if price breaks back through the moving average, the position will be closed.

Advantages

  • Can open positions along the trend and gain larger profits in trending markets
  • Uses trailing stop loss to adjust stop level based on price action, avoiding stops being too tight
  • Allows customization of moving averages and stop loss percentage according to risk appetite
  • Supports various moving average types, enabling optimization through testing
  • Simple and clear logic, easy to understand and modify

Risks

  • Price may fluctuate around moving average in range-bound markets, causing excessive trading
  • A stop loss percentage that’s too wide may lead to enlarged losses
  • Optimal parameters for moving average and stop loss may differ across products and timeframes
  • Avoid using this strategy near major news events

Risks can be optimized and controlled by:

  • Using the strategy in products and timeframes with obvious trends
  • Adjusting moving average period, using longer-term moving averages
  • Appropriately reducing stop loss percentage for tighter risk control
  • Testing separately on each product to find optimal parameters
  • Stop trading before major news events

Enhancement Opportunities

The strategy can be further optimized in the following aspects:

  1. Add other indicators for confirmation, avoiding excessive trades during range-bound markets. MACD, KD can be added, so that signals are only taken when they align.

  2. Use a combination of moving averages. For example, a 5-day MA and 20-day MA can be used together, so that trades are taken only when both align in the same direction.

  3. Test parameters separately on each product and set optimal parameters. Parameters differ across products and timeframes so separate testing is needed.

  4. Add position sizing rules. For example, fixed quantity for initial position, then add to position based on stop loss distance.

  5. Set maximum number of trades per day or minimum time between trades. This limits excessive trading.

  6. Add machine learning algorithms to dynamically optimize parameters based on historical data, avoiding static parameter setting.

  7. Incorporate deep learning models to forecast price trend, assisting with trend direction judgement.

Conclusion

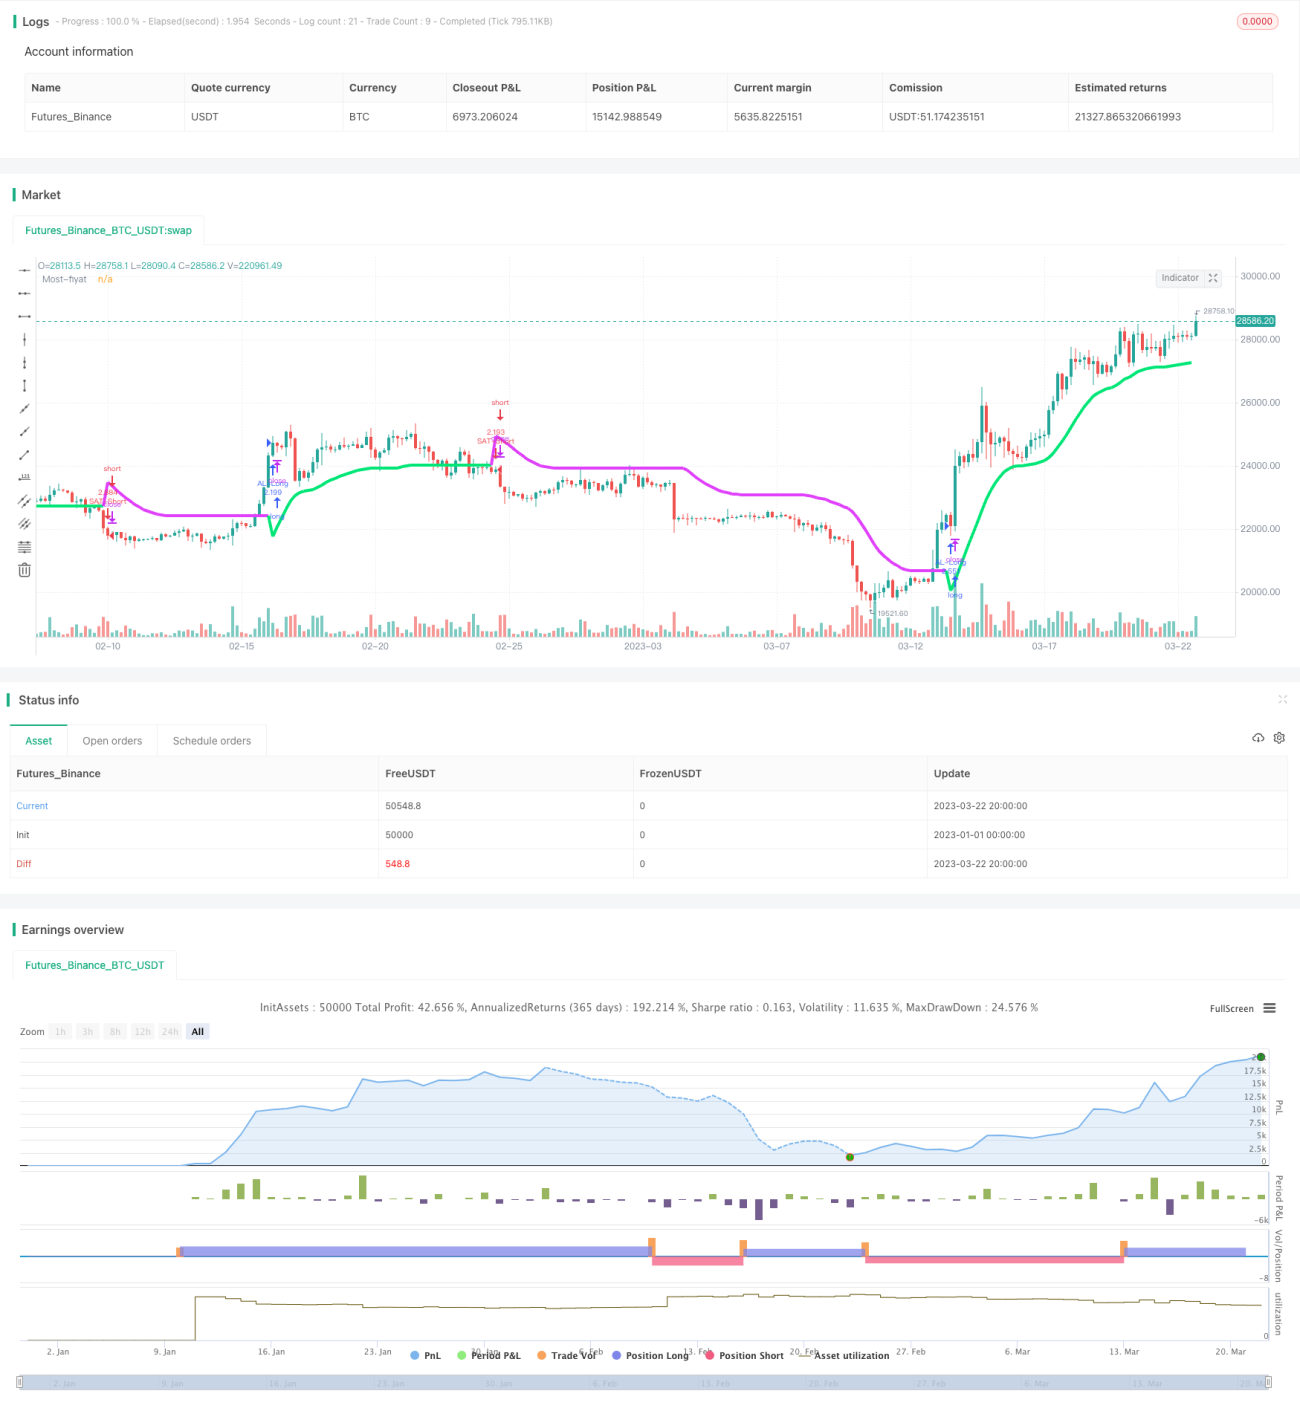
Overall this is a very practical trend following strategy. It uses moving averages to determine trend direction and trailing stops to control risk. It can produce good returns in trending markets. Combining parameter optimization and integration with other indicators or models can further enhance the stability and profitability. Users need to note differences in parameter settings across products and timeframes, as well as the impact of major events. Overall this strategy suits mid-level hedge funds and retail investors with some experience.


/*backtest
start: 2023-01-01 00:00:00
end: 2023-03-23 00:00:00
period: 4h
basePeriod: 15m
exchanges: [{"eid":"Futures_Binance","currency":"BTC_USDT"}]
*/

//@version=3
//attoCryp, @HikmetSezen58
strategy("MOST Multi MAs", overlay=true, pyramiding=1, default_qty_type=strategy.percent_of_equity, default_qty_value=100)
sx=input(defval = "close" ,title="Fiyat sec", options=[ "close", "high", "low", "open", "hl2", "hlc3", "hlco4", "hlcc4", "hlccc5"])
smox=input(defval = "HulleMA", title = "Hareketli Ortalama: ", options=["T3", "SMA", "EMA", "DEMA", "TEMA", "WMA", "VWMA", "SMMA", "EVWMA", "HullMA", "HulleMA", "LSMA", "ALMA", "TMA", "SSMA"])
timeFramemost = input(title="++++++++++++++++++++++++++++++++++++", defval="MOST Ayarlari:")
yuzde=input(defval=3.8, minval=0, step=0.1, title="Yuzde Oran")/100
ortalamauzunluk=input(defval=28, title="Periyot Uzunlugu", minval=1)
f=input(defval=0.4, step=0.1, title="T3 icin Factor", minval=0.01)
timeFrameadd=input(title="++++++++++++++++++++++++++++++++++++", defval="Diger Orta.Ayar:")
offsig=input(defval=4, title="LSMA icin Offset veya ALMA icin Sigma", minval=0)
offalma=input(defval=0.6, title="ALMA icin Offset", minval=0, step=0.01)
timeFramess=input(title="++++++++++++++++++++++++++++++++++++", defval="Baslangic-Bitis:")
gun_baslangic=input(defval=1, title="Baslangic Gunu", minval=1, maxval=31)
ay_baslangic=input(defval=1, title="Baslangic Ayi", minval=1, maxval=12)
yil_baslangic=input(defval=2017, title="Baslangic Yili", minval=2010)
gun_bitis=input(defval=1, title="Bitis Gunu", minval=1, maxval=31)
ay_bitis=input(defval=1, title="Bitis Ayi", minval=1, maxval=12)
yil_bitis = input(defval=2019, title="Bitis Yili", minval=2010)

// backtest icin baslangic ve bitis zamanlarini belirleme
baslangic=timestamp(yil_baslangic, ay_baslangic, gun_baslangic, 00, 00)
bitis=timestamp(yil_bitis, ay_bitis, gun_bitis, 23, 59) 
zamanaraligi() => true

//guncel fiyatti belirleme
guncelfiyat=sx=="high"?high : sx=="close"?close : sx=="low"?low : sx=="open"?open : sx=="hl2"?(high+low)/2 : sx=="hlc3"?(high+low+close)/3 : sx=="hlco4"?(high+low+close+open)/4 : sx=="hlcc4"?(high+low+close+close)/4 : sx=="hlccc5"?(high+low+close+close+close)/5 : close 

/////Ortalama Hesaplamalari/////
// Tillson T3
sm0(guncelfiyat,ortalamauzunluk,f) =>
    t3e1=ema(guncelfiyat, ortalamauzunluk)
    t3e2=ema(t3e1, ortalamauzunluk)
    t3e3=ema(t3e2, ortalamauzunluk)
    t3e4=ema(t3e3, ortalamauzunluk)
    t3e5=ema(t3e4, ortalamauzunluk)
    t3e6=ema(t3e5, ortalamauzunluk)
    c1=-f*f*f
    c2=3*f*f+3*f*f*f
    c3=-6*f*f-3*f-3*f*f*f
    c4=1+3*f+f*f*f+3*f*f
    s0=c1 * t3e6 + c2 * t3e5 + c3 * t3e4 + c4 * t3e3

// Basit ortalama
sm1(guncelfiyat,ortalamauzunluk) =>
    s1=sma(guncelfiyat, ortalamauzunluk)

// Ustel ortalama
sm2(guncelfiyat,ortalamauzunluk) =>
    s2=ema(guncelfiyat, ortalamauzunluk)

// Cift Ustel ortalama
sm3(guncelfiyat,ortalamauzunluk) =>
    s3=2*ema(guncelfiyat, ortalamauzunluk) - ema(ema(guncelfiyat, ortalamauzunluk), ortalamauzunluk)

// Uclu Ustel ortalama
sm4(guncelfiyat,ortalamauzunluk) =>
    s4=3*(ema(guncelfiyat, ortalamauzunluk) - ema(ema(guncelfiyat, ortalamauzunluk), ortalamauzunluk)) + ema(ema(ema(guncelfiyat, ortalamauzunluk), ortalamauzunluk), ortalamauzunluk)

// Agirlikli Ortalama  
sm5(guncelfiyat,ortalamauzunluk) =>
    s5=wma(guncelfiyat, ortalamauzunluk)

// Hacim Agirlikli Ortalama
sm6(guncelfiyat,ortalamauzunluk) =>
    s6=vwma(guncelfiyat, ortalamauzunluk)

// Smoothed
sm7(guncelfiyat,ortalamauzunluk) =>
    s7=0.0
    s7:=na(s7[1]) ? sma(guncelfiyat, ortalamauzunluk) : (s7[1] * (ortalamauzunluk - 1) + guncelfiyat) / ortalamauzunluk

// Hull Ortalama
sm8(guncelfiyat,ortalamauzunluk) =>
    s8=wma(2 * wma(guncelfiyat, ortalamauzunluk / 2) - wma(guncelfiyat, ortalamauzunluk), round(sqrt(ortalamauzunluk)))
    
// Hull Ustel Ortalama
sm81(guncelfiyat,ortalamauzunluk) =>
    s8=ema(2 * ema(guncelfiyat, ortalamauzunluk / 2) - ema(guncelfiyat, ortalamauzunluk), round(sqrt(ortalamauzunluk)))

// Least Square
sm9(guncelfiyat,ortalamauzunluk,offsig) =>
    s9=linreg(guncelfiyat, ortalamauzunluk, offsig)

// Arnaud Legoux
sm10(guncelfiyat, ortalamauzunluk, offalma, offsig) =>
    s10=alma(guncelfiyat, ortalamauzunluk, offalma, offsig)

// Triangular
sm11(guncelfiyat, ortalamauzunluk) =>
    s11=sma(sma(guncelfiyat, ortalamauzunluk),ortalamauzunluk)

// SuperSmoother filter
sm12(guncelfiyat,ortalamauzunluk) =>
    a1=exp(-1.414*3.14159 / ortalamauzunluk)
    b1=2*a1*cos(1.414*3.14159 / ortalamauzunluk)
    c2=b1
    c3=(-a1)*a1
    c1=1 - c2 - c3
    s12=0.0
    s12:=c1*(guncelfiyat + nz(guncelfiyat[1])) / 2 + c2*nz(s12[1]) + c3*nz(s12[2])
    
//Elastic Volume Weighted Moving Average
sm13(guncelfiyat,ortalamauzunluk) =>
    hacimtoplam=sum(volume, ortalamauzunluk)
    s13=0.0
    s13:=(nz(s13[1]) * (hacimtoplam - volume)/hacimtoplam) + (volume*guncelfiyat/hacimtoplam)

ortalamafiyat=smox=="T3"?sm0(guncelfiyat,ortalamauzunluk,f) : smox=="SMA"?sm2(guncelfiyat,ortalamauzunluk) : smox=="EMA"?sm2(guncelfiyat,ortalamauzunluk) : smox=="DEMA"?sm3(guncelfiyat,ortalamauzunluk) : smox=="TEMA"?sm4(guncelfiyat,ortalamauzunluk) : smox=="WMA"?sm5(guncelfiyat,ortalamauzunluk) : smox=="VWMA"?sm6(guncelfiyat,ortalamauzunluk) : smox=="SMMA"?sm7(guncelfiyat,ortalamauzunluk) : smox=="HullMA"?sm8(guncelfiyat,ortalamauzunluk) : smox=="HulleMA"?sm81(guncelfiyat,ortalamauzunluk) : smox=="LSMA"?sm9(guncelfiyat,ortalamauzunluk,offsig) : smox=="ALMA"?sm10(guncelfiyat, ortalamauzunluk, offalma, offsig) : smox=="TMA"?sm11(guncelfiyat,ortalamauzunluk) : smox=="SSMA"?sm12(guncelfiyat,ortalamauzunluk) : smox=="EVWMA"?sm13(guncelfiyat,ortalamauzunluk) : guncelfiyat

/////MOST'u hesaplama/////
stopfiyat=ortalamafiyat*yuzde
mostfiyat=0.0
mostfiyat:=iff(ortalamafiyat>nz(mostfiyat[1],0) and ortalamafiyat[1]>nz(mostfiyat[1],0),max(nz(mostfiyat[1],0),ortalamafiyat-stopfiyat),iff(ortalamafiyat<nz(mostfiyat[1],0) and ortalamafiyat[1]<nz(mostfiyat[1],0),min(nz(mostfiyat[1],0),ortalamafiyat+stopfiyat),iff(ortalamafiyat>nz(mostfiyat[1],0),ortalamafiyat-stopfiyat,ortalamafiyat+stopfiyat)))

mostcolor=ortalamafiyat>mostfiyat?lime:fuchsia
plot(mostfiyat, color=mostcolor, linewidth=4, title="Most-fiyat")

/////AL-SAT LONG-SHORT girislerini belirleme/////
long=ortalamafiyat>mostfiyat and ortalamafiyat[1]<mostfiyat[1]
short=ortalamafiyat<mostfiyat and ortalamafiyat[1]>mostfiyat[1]
if (long) 
    strategy.entry("AL-Long", strategy.long, when = zamanaraligi())
if (short) 
    strategy.entry("SAT-Short", strategy.short, when = zamanaraligi())

More