Following the Supertrend Strategy

Following the Supertrend Strategy
Overview
This strategy is based on the Supertrend indicator to determine the trend direction using Supertrend lines, and take Supertrend lines as stop loss lines to implement an automated trading strategy that follows Supertrend trends. It is suitable for products with obvious trend tendencies and can capture mid-to-long term trends to follow strong trends.
Strategy Principle
The Supertrend indicator is calculated from the Average True Range (ATR) and a multiplier, which can effectively determine the price trend direction. When the price is above the upper Supertrend line, it is an upward trend. When the price is below the lower Supertrend line, it is a downward trend.
The strategy first calculates the upper and lower Supertrend lines. The upper Supertrend line is calculated as the average of the highest and lowest prices minus the ATR multiplied by N. The lower Supertrend line is calculated as the average of the highest and lowest prices plus the ATR multiplied by N. Where N is the multiplier parameter set by the user.
Then it calculates the direction of the trend relative to the price. When the price is higher than the lower Supertrend line of the previous bar, it is defined as an upward trend. When the price is lower than the upper Supertrend line of the previous bar, it is defined as a downward trend.
According to the determined trend direction, choose the upper Supertrend line or the lower Supertrend line as the Supertrend line. When it is an upward trend, take the upper Supertrend line as the Supertrend line. When it is a downward trend, take the lower Supertrend line as the Supertrend line.
Finally, the strategy takes the Supertrend line as the stop loss line. It goes long when the price crosses above the Supertrend line, and goes short when the price crosses below the Supertrend line. It exits the position once the price touches the Supertrend line.
Advantage Analysis
The main advantages of this strategy are:
-
Using the Supertrend indicator to determine the price trend direction can effectively follow trends.
-
The Supertrend line as a stop loss line can limit losses.
-
The strategy has a small drawdown with a Sharpe ratio of 2.51, showing stable performance.
-
There are as many as 1988 trades, allowing parameter optimization to improve win rate.
-
It implements fully automated trading without manual intervention.
Risk Analysis
There are also some risks with this strategy:
-
The Supertrend indicator is sensitive to price changes and may generate more whipsaw signals, reducing profitability.
-
It is prone to stop loss in range-bound trends and is not suitable for sideways products.
-
It does not consider the impact of major economic events, which may cause large losses during those periods.
-
The profit ratio is only 41% and the win rate needs improvement.
-
Parameters need to be optimized for different products and time frames.
-
Strict money management is required to prevent excessive losses in single trades.
Optimization Directions
The strategy can be optimized in the following aspects:
-
Add filters with other indicators to avoid whipsaws and improve win rate, such as MA, MACD, etc.
-
Increase trend confirmation to avoid wrong signals from Supertrend line misjudgments. For example, add channel breakout confirmation.
-
Adjust parameters to suit different products and time frames, such as adjusting ATR period.
-
Add strategies to avoid major economic news events.
-
Optimize stop loss strategies through trailing stop loss, parabolic SAR, etc.
-
Optimize position sizing based on market conditions by adjusting xpos to control risk exposure.
Conclusion
This strategy designed a simple trend following strategy based on the Supertrend indicator with decent performance, but more trading signals and room for improving win rate. By optimizing with other indicators for filtration, adjusting parameters for different products, and applying prudent money management, this strategy can become a stable trend following strategy with mild drawdown. But be aware of the risks associated with misjudgments.
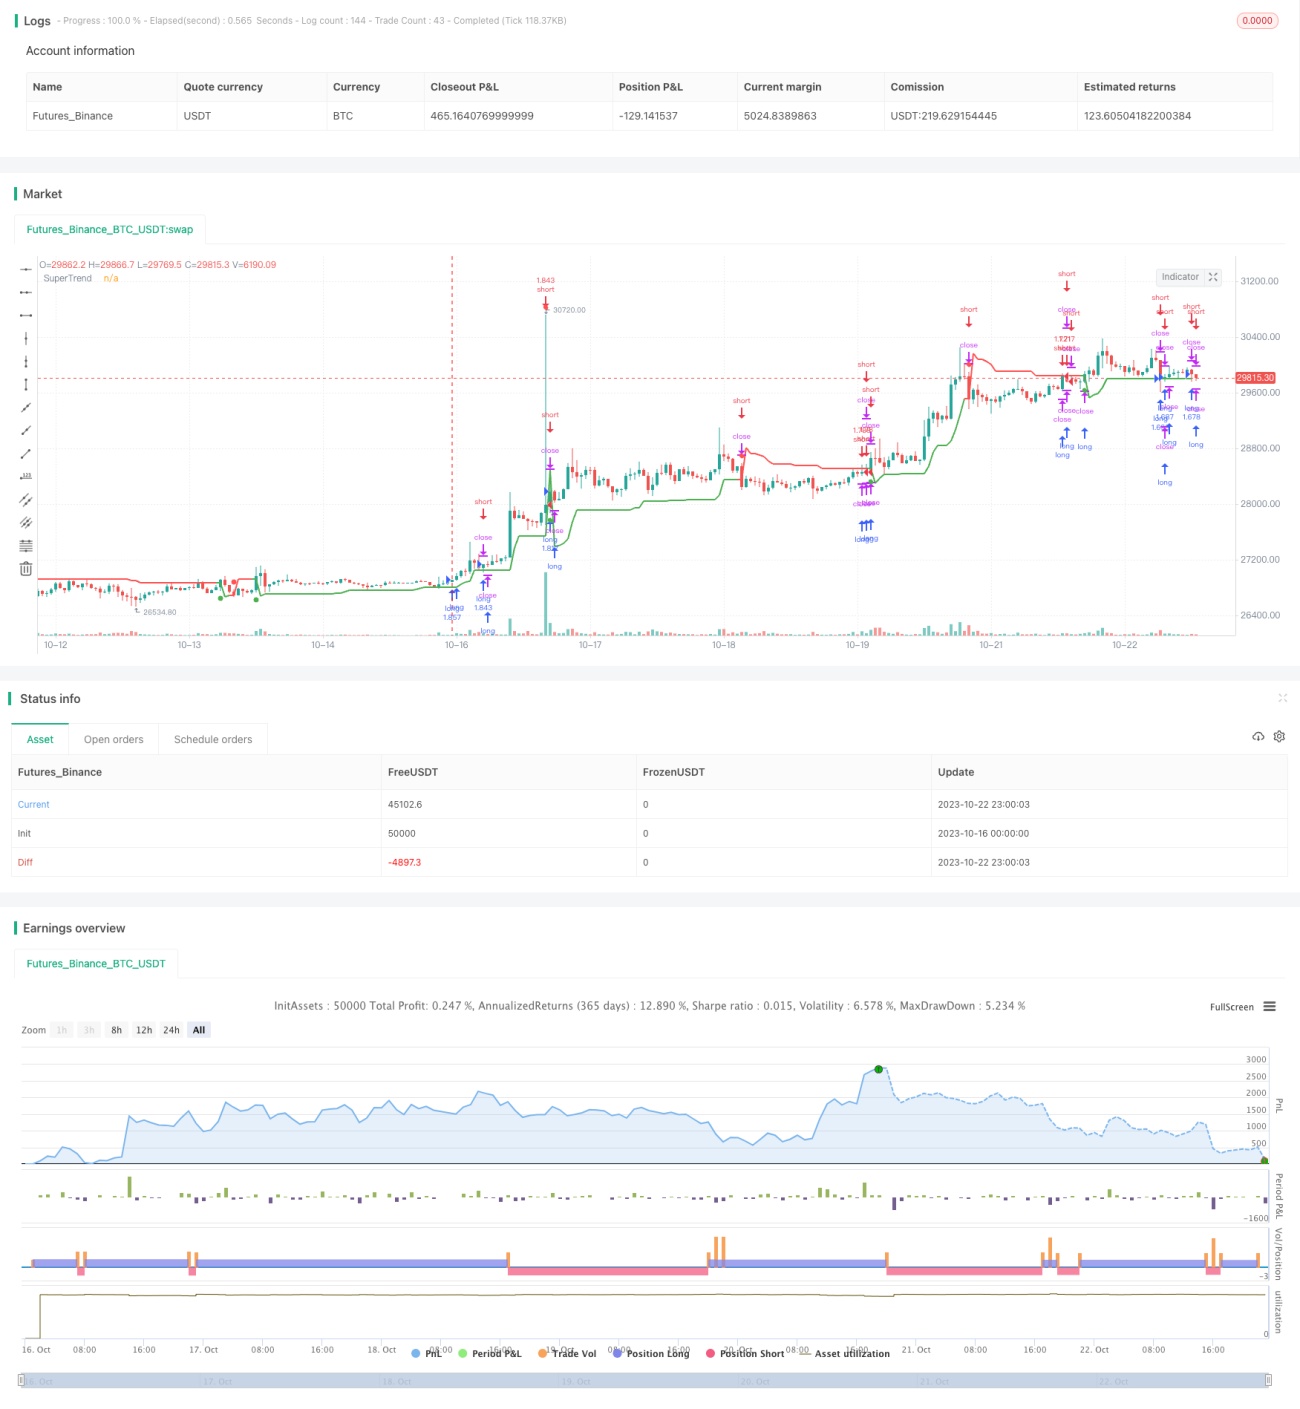
/*backtest
start: 2023-10-16 00:00:00
end: 2023-10-23 00:00:00
period: 1h
basePeriod: 15m
exchanges: [{"eid":"Futures_Binance","currency":"BTC_USDT"}]
*/

//@version=4
strategy("QuantNomad - SuperTrend - XBTUSD - 1m", overlay = true, default_qty_type = strategy.percent_of_equity, default_qty_value = 100)

// INPUTS //- 1