Multi Timeframe Stochastic Crossover Strategy

Overview
The Multi Timeframe Stochastic Crossover Strategy is a typical trend following strategy. It calculates the standard deviation values across different timeframes (e.g. daily, weekly, monthly etc.), constructs multiple K and D lines, takes the average of these lines to build moving averages, and goes long when the fast line crosses above the slow line and goes short when the fast line crosses below the slow line. By combining standard deviation lines across multiple timeframes, this strategy can effectively filter out market noise and capture the predominant trend.
Strategy Logic
The core logic of this strategy is to compute the standard deviation across multiple timeframes and then take the average to generate trading signals.
Firstly, the strategy calculates K values of standard deviation under different parameters across 5 groups, corresponding to daily, weekly and monthly timeframes:
pine
smoothK = input(55)
SMAsmoothK = input(13)
k = sma(stoch(price, high, low, smoothK), SMAsmoothK)
smoothK1 = input(89)
SMAsmoothK1 = input(8)
k1 = sma(stoch(price, high, low, smoothK1), SMAsmoothK1)
...
smoothK4 = input(377)
SMAsmoothK4 = input(2)
k4 = sma(stoch(price, high, low, smoothK4), SMAsmoothK4)
Then it computes D lines with different parameters respectively:
            pine

            smoothD = input(34)
d = sma(k, smoothD)

...

smoothD4 = input(233)
d4 = sma(k4, smoothD4)
Next, it calculates the average of K and D lines to get the fast line Kavg and slow line Davg:
            pine

            Kavg = avg(k,k1,k2,k3,k4)
Davg = avg(d,d1,d2,d3,d4)
Finally, it goes long when Kavg crosses above Davg, and goes short when Kavg crosses below Davg:
            pine

            long = crossover(Kavg, Davg)
short = crossunder(Kavg, Davg)
By combining standard deviation lines across multiple timeframes, this strategy can filter out market noise in larger timeframes and capture the predominant trend direction.
Advantages
- Utilizes predictive power of standard deviation across multiple timeframes to filter out noise and capture trends
- Flexibility to adjust holding period by tuning timeframe parameters
- Standard deviation itself has strong trend following characteristics
- Moving average crossover avoids being misled by single fake breakouts
- Easy to optimize moving average periods for more stability
Risks and Solutions
- Multiple timeframe moving average crossovers can generate many false signals, optimize moving average periods
- Standard deviation prone to errors from volatile moves, consider adding filters
- Fixed periods cannot adapt to market changes, adopt adaptive periods
- Long holding periods risk chasing tops and bottoms, use trailing stops to lock in profits
- Reliance on just KDJ indicator is limiting, combine with other indicators
Solutions:
-
Add filters to avoid false breakout signals
-
Use adaptive periods based on market volatility
-
Employ trailing stops to exit trades timely
-
Optimize moving average periods for best balance
-
Incorporate more indicators to improve robustness
Enhancement Opportunities
This strategy can be further improved in the following areas:
-
Incorporate other indicator signals like MACD, Bollinger Bands to improve signal quality
-
Add trend filters like SMA direction, ADX to avoid counter-trend trades
-
Utilize adaptive periods based on market volatility
-
Implement trailing stops based on strategy parameters to exit trades
-
Optimize fast and slow moving average periods for best parameters
-
Add entry filters to avoid false signals from short-term noise
-
Test breakout entry after crossover of moving averages
-
Evaluate different exit strategies like Chandelier Exit to optimize exits
Conclusion
The Multi Timeframe Stochastic Crossover Strategy combines the trend following capability of stochastic indicator and stability of moving average strategies. By taking average of multi-period standard deviation K and D lines to generate signals, it effectively utilizes predictive power of standard deviation across different timeframes, filters out market noise, and captures the predominant trend. This strategy has room for parameter tuning and further enhancements like filters, stops, etc. Overall, it integrates the strengths of multiple technical analysis tools and is an efficient trend following strategy worth exploring and optimizing.
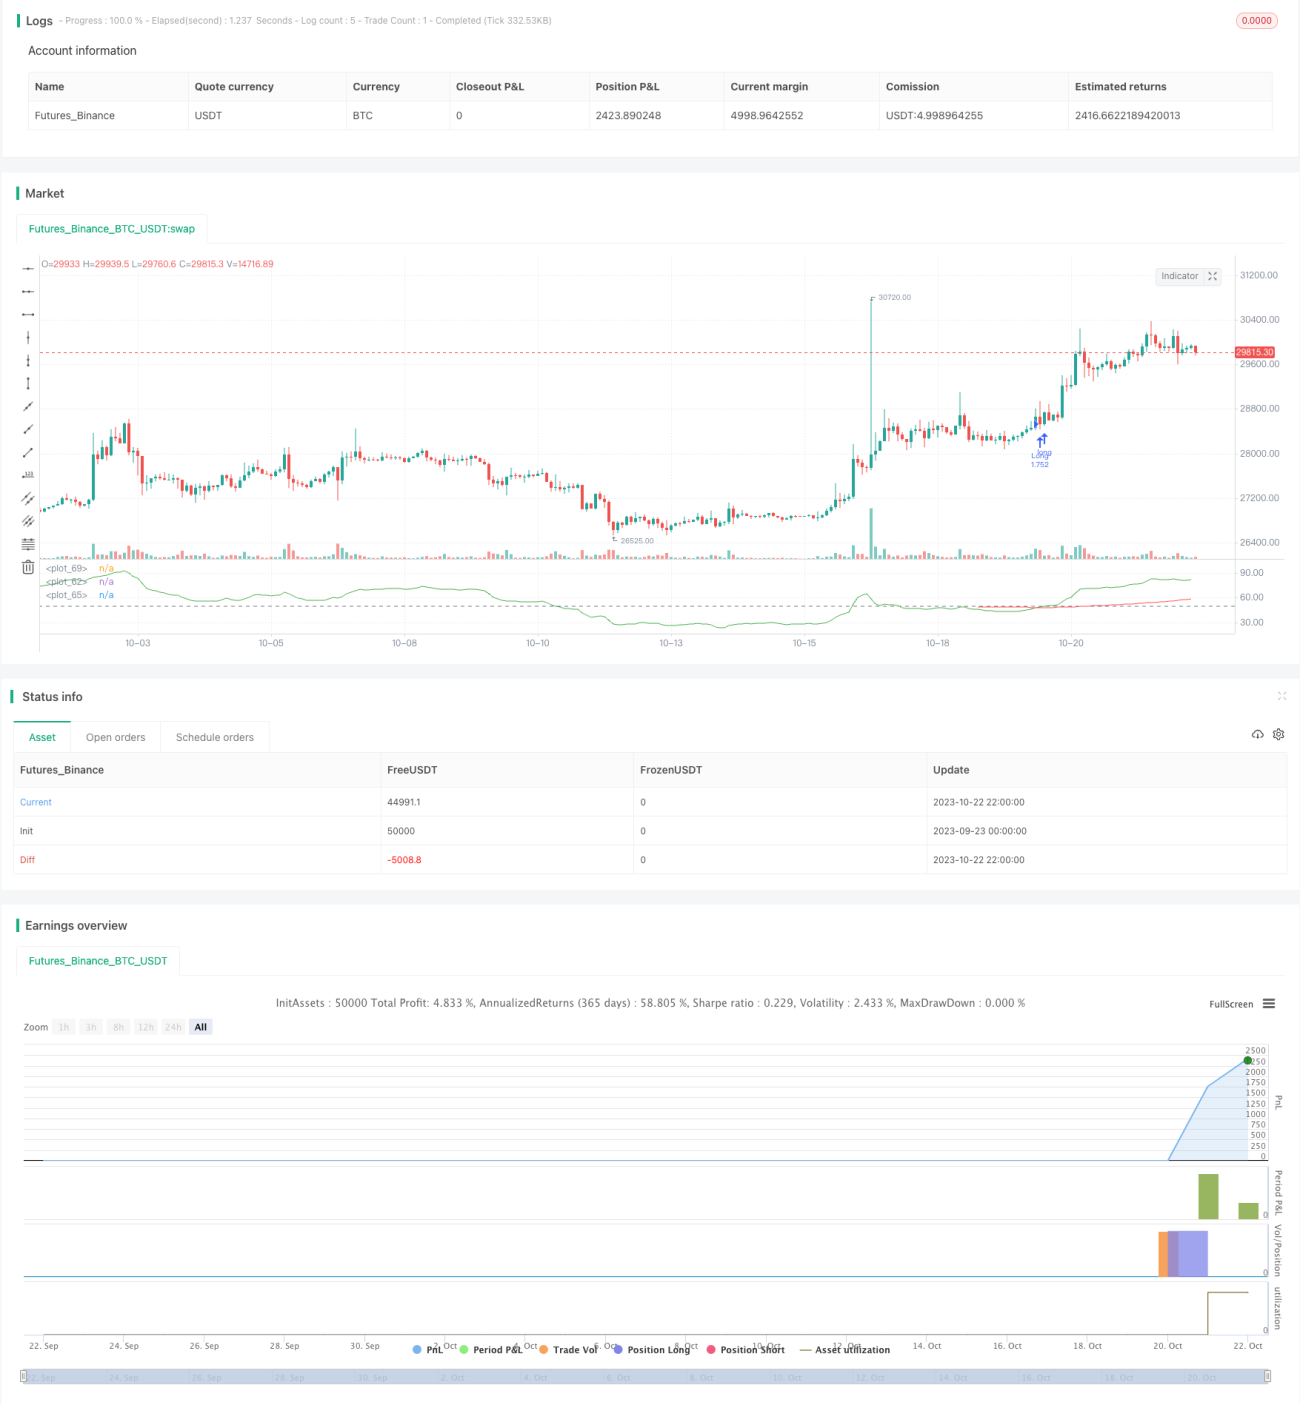
/*backtest
start: 2023-09-23 00:00:00
end: 2023-10-23 00:00:00
period: 2h
basePeriod: 15m
exchanges: [{"eid":"Futures_Binance","currency":"BTC_USDT"}]
*/

//@version=2
strategy(title="Slow Stochastic Multi K&D Average Crossover Strategy", overlay=false, pyramiding=0, calc_on_order_fills=true, initial_capital=100000, default_qty_type=strategy.percent_of_equity, currency="USD", default_qty_value=100)
- 1