A Trend Following Strategy

Overview
This strategy combines the extremes of the Relative Strength Index (RSI) indicator and the filtering of the Simple Moving Average (SMA) to track trends. When the RSI reaches extreme overbought or oversold levels, long and short directions are determined based on the SMA direction. The strategy is suitable for US stock indexes, European indexes, Asian indexes, gold, silver and other varieties. Through simple RSI and SMA rules, it effectively captures trends.
Strategy Logic
-
Calculate the RSI indicator value, set the overbought threshold upper limit to 65, and the oversold threshold lower limit to 45.
-
Calculate the 200-day SMA to determine the trend direction.
-
When RSI is below 45 (oversold) and price is above SMA, go long; when RSI is above 65 (overbought) and price is below SMA, go short.
-
When RSI is above 75 (strongly overbought) and price is above SMA, close long positions; when RSI is below 25 (strongly oversold) and price is below SMA, close short positions.
The strategy captures trends effectively by using RSI extremes to time entries and SMA direction for filtering. RSI extremes indicate potential reversals, while SMA direction ensures trades align with the trend. Together, they ensure reasonable trades and higher win rates.
Advantages
-
Simple and clear strategy logic, easy to understand and master.
-
Based on well-known RSI and SMA indicators, easy to implement.
-
RSI extremes indicate potential reversal points, SMA filters ensure directional correctness.
-
Reasonable parameter settings avoid excessive trading.
-
Applicable to multiple products like indexes and commodities.
-
Captures significant price swings during trends.
Compared to RSI alone, the strategy adds SMA trend filter to avoid blind long/short. Compared to SMA systems alone, the strategy improves timing efficiency by using RSI extremes. Overall, it combines the strengths of both for a practical trend following strategy.
Risks and Solutions
-
SMA death cross poses trend reversal risks. Use shorter SMA periods for increased sensitivity.
-
RSI divergences risk missing trades. Add other indicators like MACD to detect anomalies.
-
Both RSI and SMA may generate false signals during ranging markets. Pause trading when range-bound market detected.
-
Improper parameter settings lead to overtrading or missed trades. Optimize parameters to find best combination.
-
Single product backtest insufficient to evaluate strategy. Validate across multiple products.
-
Backtest ≠ live trading. Manage risk and capital in live trading.
Improvement Directions
-
Optimize RSI periods for different products.
-
Optimize SMA periods, integrate multiple SMAs.
-
Add stop loss for better risk control.
-
Add other indicators for multi-factor confirmation.
-
Improve entry timing with volatility indicators.
-
Develop adaptive parameter system for dynamic optimization.
-
Test different capital management approaches for optimum.
-
Create strategy ensemble for different market conditions.
Conclusion
The RSI extremes with SMA filter strategy combines the strengths of both for effective trend following. The logic is clear and parameters solid. It works across multiple products to significantly improve timing efficiency and win rate compared to RSI or SMA systems alone. There is room for improvements like parameter optimization and stop loss to further enhance robustness and adaptiveness. Overall, it provides trend traders with a very useful and effective tool.
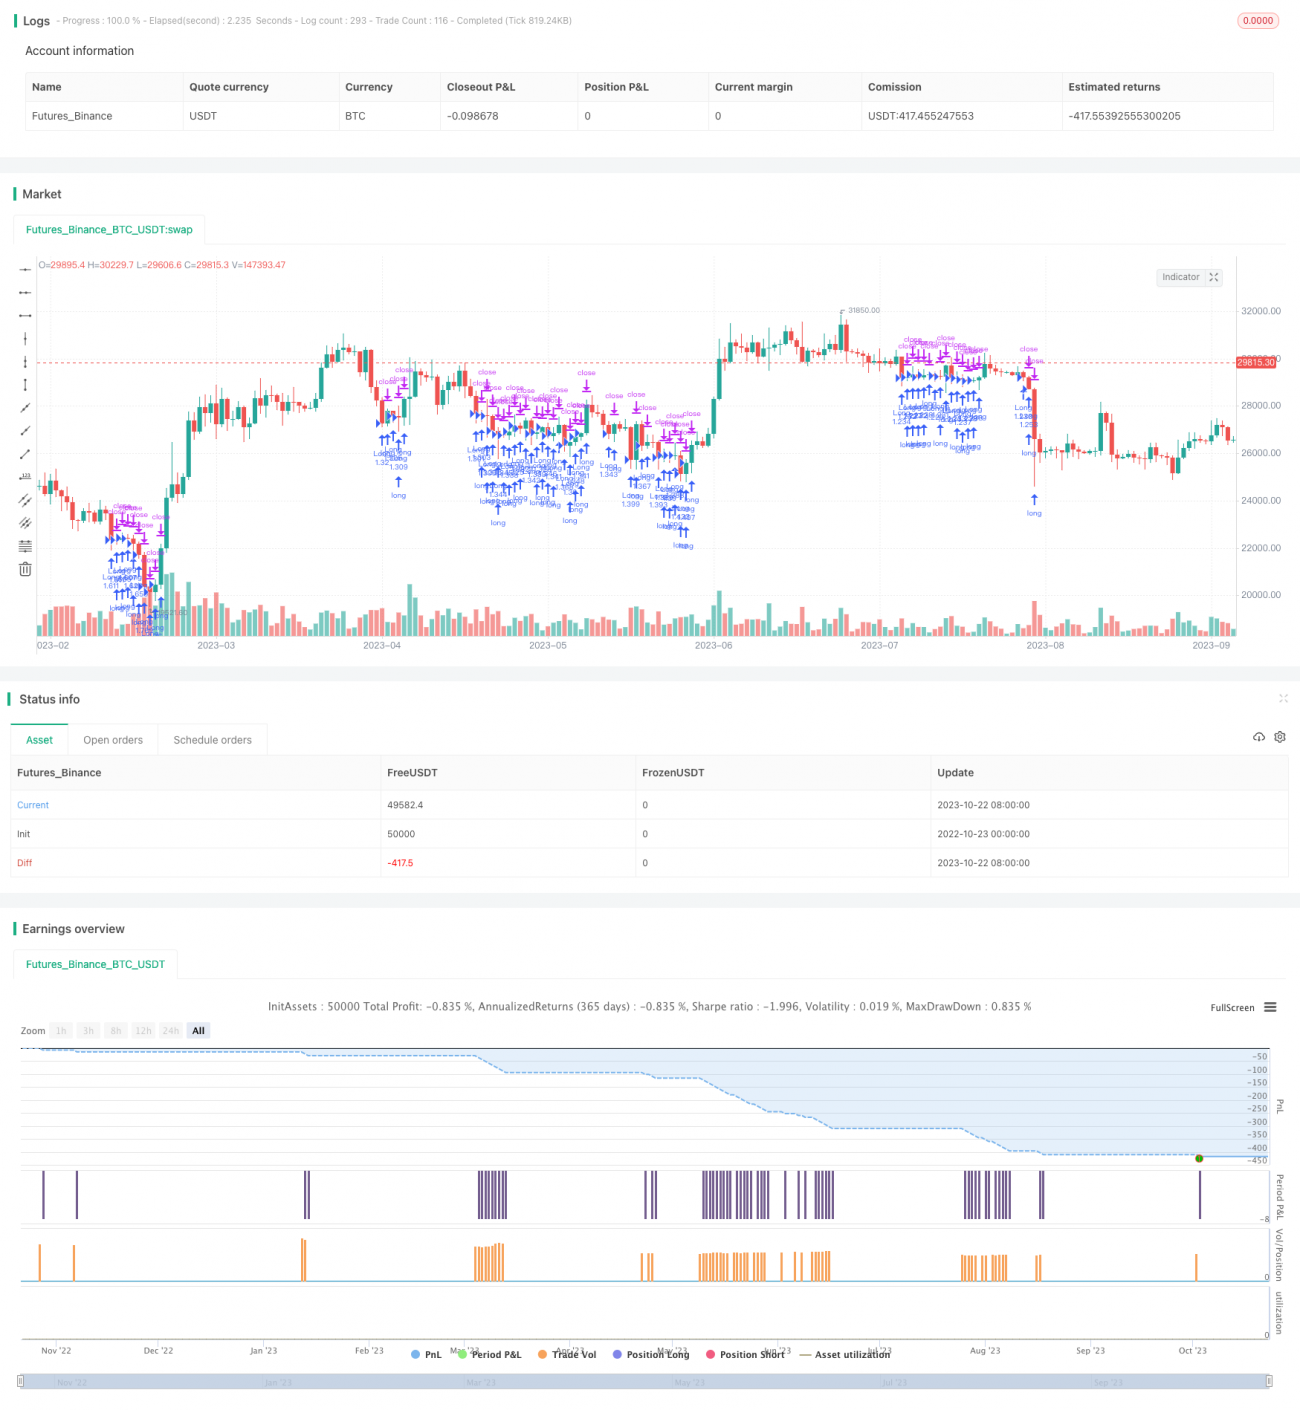
/*backtest
start: 2022-10-23 00:00:00
end: 2023-10-23 00:00:00
period: 1d
basePeriod: 1h
exchanges: [{"eid":"Futures_Binance","currency":"BTC_USDT"}]
*/

// This work is licensed under a Attribution-NonCommercial-ShareAlike 4.0 International (CC BY-NC-SA 4.0) https://creativecommons.org/licenses/by-nc-sa/4.0/
// © wielkieef

//@version=5- 1