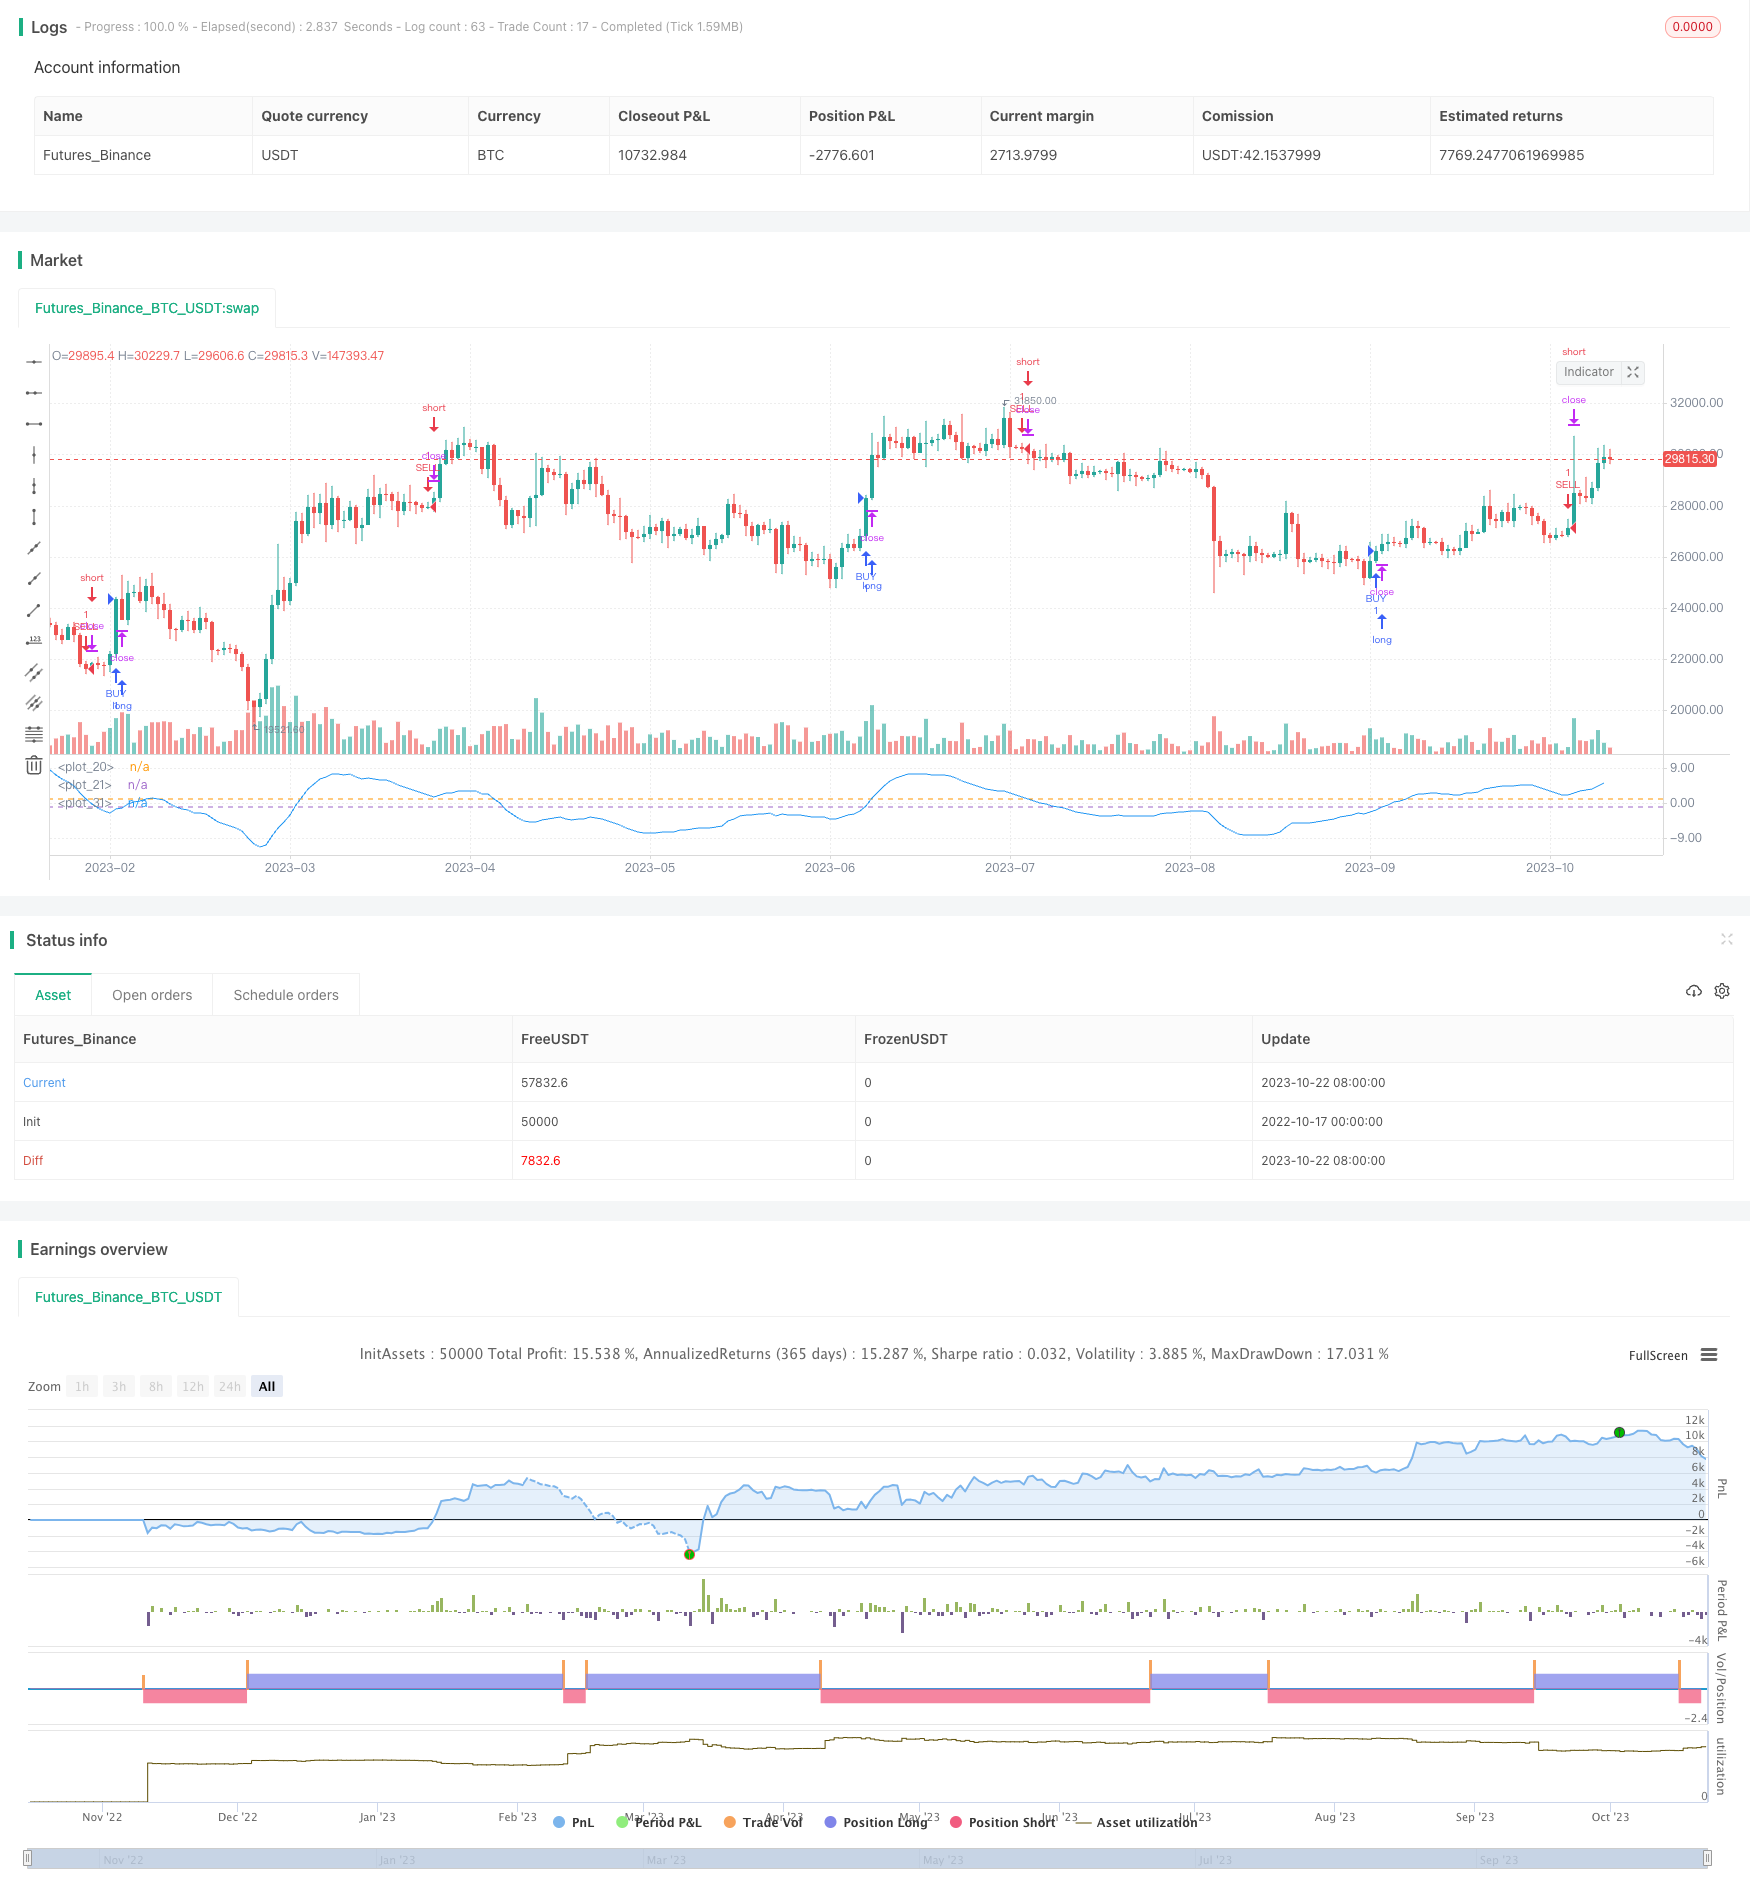
概述
该策略运用双指数移动平均线(DEMA)计算价格的波动率,并对波动率进行再平滑处理,从而发现价格波动的趋势,在波动率上升时做多,在波动率下降时做空。
策略原理
计算价格的双指数移动平均线(DEMA),公式为:DEMA = 2*EMA(price, N) - EMA(EMA(price, N), N)
计算价格相对于DEMA的波动率:波动率 = (price - DEMA) / price * 100%
对波动率进行再次DEMA平滑处理,获取波动率的趋势信号
当再平滑后的波动率上穿某一水平时,做多;当再平滑后的波动率下穿某一水平时,做空
可设定只在某个时间段内交易
策略优势
使用双指数移动平均线,能更快捕捉价格变化趋势
波动率能反映市场的多空情绪,波动率上升代表多头占优,下降代表空头占优
对波动率进行二次平滑,可过滤掉短期噪音,捕捉主要趋势
可设定只在特定时间段交易,避免不必要的滑点损失
采用止损、离场策略,可控制风险
策略风险
在剧烈行情时,DEMA可能产生滞后,从而错过最佳入场点位
波动率指标可能出现虚假突破,应结合其他指标进行验证
sollte设定止损点位,以防止亏损扩大
在交易时间段之外,会错过交易机会
交易时间段的选择需要根据历史数据测试,不恰当的时间段可能降低收益
风险解决方案
优化DEMA参数,采用更小幅度的N值
结合其他指标如RSI、MACD等进行综合判断
根据历史数据和最大可承受亏损确定止损点
优化交易时间段的选择
对不同品种分别测试最佳交易时间段
策略优化方向
测试不同的DEMA参数组合,找到平滑效果最佳的参数
尝试其他不同类型的移动平均线,如EMA、SMA等
对波动率指标进行多次平滑,找到最佳的平滑参数
添加其他辅助指标,实现多因子 verification
使用机器学习等方法自动优化入场和离场参数
针对不同品种分别测试最佳参数组合
增加止损和离场策略,严格控制风险
总结
该策略通过计算价格的DEMA波动率并进行再平滑,能快速发现市场多空情绪的变化趋势,在波动率上升时做多,在波动率下降时做空,实现顺势交易。但策略可能存在DEMA滞后、虚假突破等问题。应优化参数,严格止损,并辅助其他指标进行综合判断。如果使用得当,该策略可以抓住市场趋势换向的机会,获得较好的投资回报。
/*backtest
start: 2022-10-17 00:00:00
end: 2023-10-23 00:00:00
period: 1d
basePeriod: 1h
exchanges: [{"eid":"Futures_Binance","currency":"BTC_USDT"}]
*/

//@version= 2
strategy("DEMA of DPD Strategy ",shorttitle="DPD% DEMA " ,overlay=false)

buyper =input(-2)
sellper=input(2)

demalen = input(50,title="Dema Length")

e1= ema(close,demalen)
e2=ema(e1,demalen)
demaprice  =   2 * e1 - e2

price=close
demadifper =  ((price-demaprice)/price)*100


OverDemaPer = input(1, title="Band for OverBought")
UnderDemaPer= input(-1,title="Band for OverSold")

band1 = hline(OverDemaPer)
band0 = hline(UnderDemaPer)
zeroline=0
fill(band1, band0, color=green, transp=90)


demalen2 = input(21,title="DEMA to Calculate dema of DPD")
demaofdpd =ema(demadifper,demalen2)
demaofdpd2 =ema(demaofdpd,demalen2)
resultstrategy = 2*demaofdpd - demaofdpd2

plot(resultstrategy,color=blue)


yearfrom = input(2018)
yearuntil =input(2019)
monthfrom =input(6)
monthuntil =input(12)
dayfrom=input(1)
dayuntil=input(31)


if (  crossover(resultstrategy,buyper)  )
    strategy.entry("BUY", strategy.long, stop=close, oca_name="TREND",  comment="BUY")

else
    strategy.cancel(id="BUY")


if ( crossunder(resultstrategy,sellper) )

    strategy.entry("SELL", strategy.short,stop=close, oca_name="TREND",  comment="SELL")
else
    strategy.cancel(id="SELL")