Monthly Trend Breakout Strategy

Overview
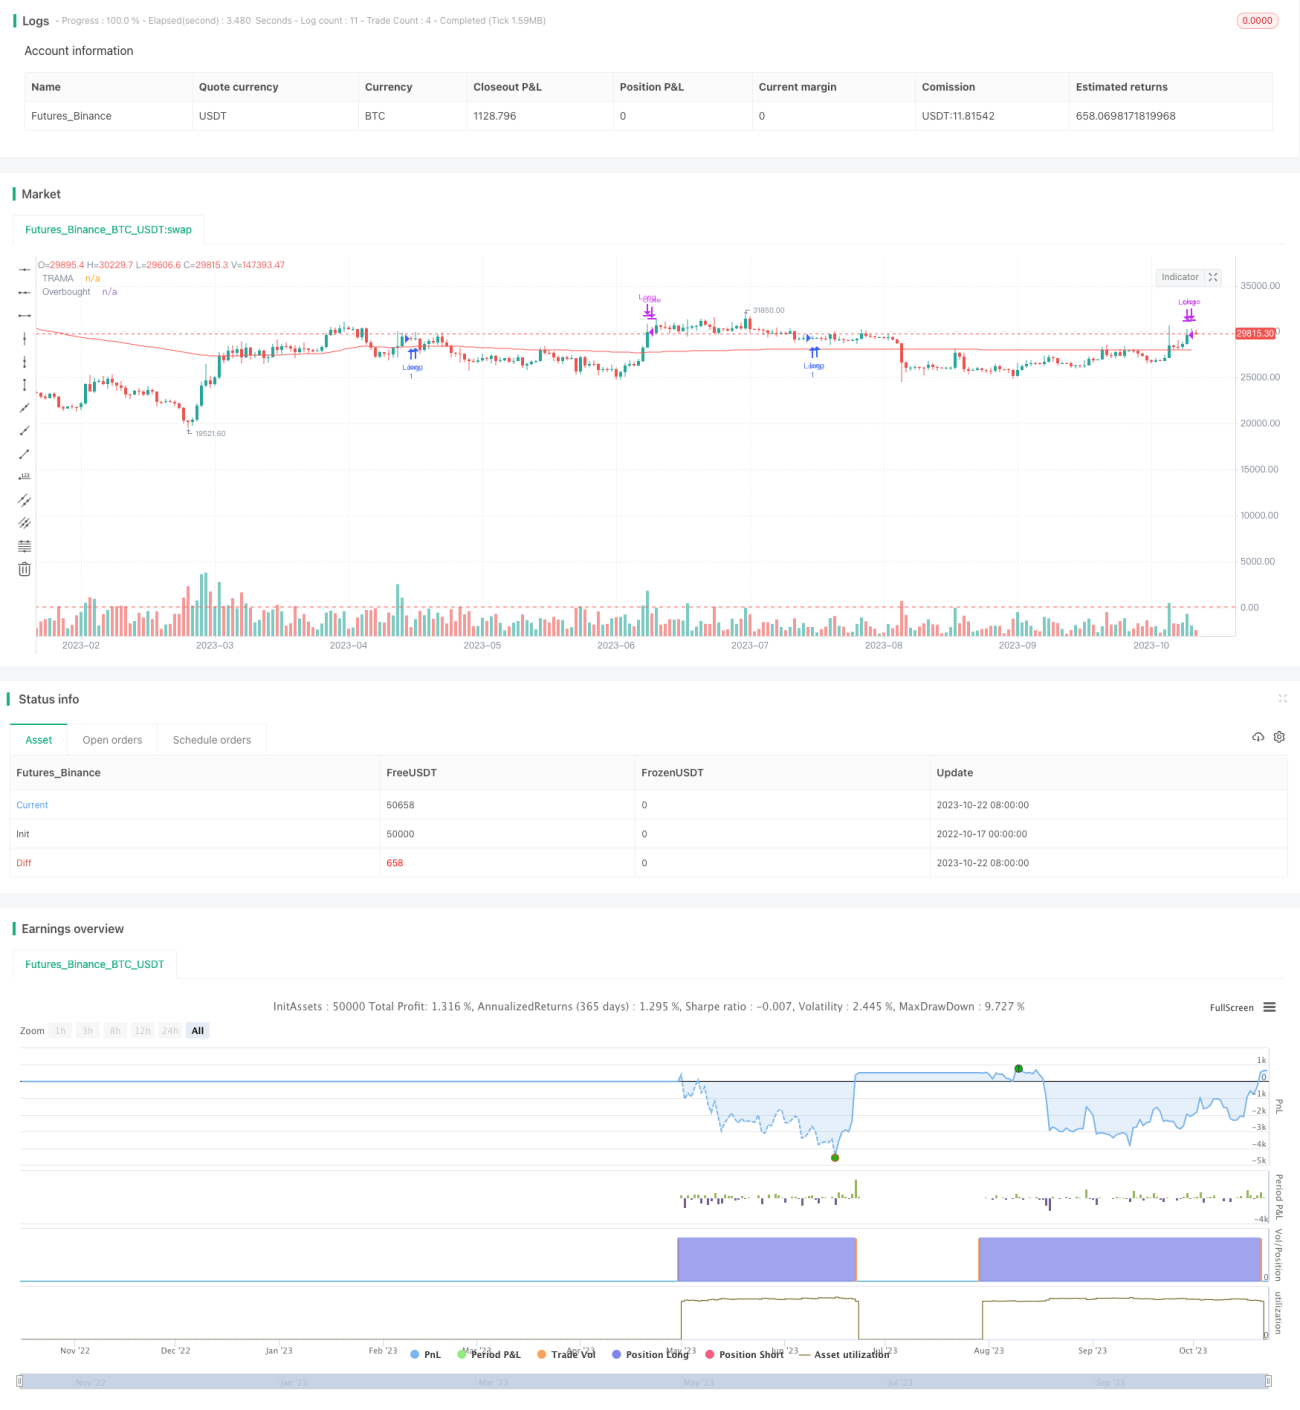
The Monthly Trend Breakout Strategy is a TradingView indicator based on Pine Script. It combines an adaptive moving average, trendline breakouts and the RSI indicator to determine long entry signals once per month. Exits occur when the RSI shows overbought conditions.
Strategy Logic
-
Define variable lastEntryMonth to track last entry month. currentMonth gets current month.
-
Set TRAMA adaptive MA parameters length=99 to smooth price and determine trend.
-
Set length_trend=14 to plot trendline upper based on pivot highs. Long when price breaks above trendline.
-
Calculate RSI indicator with rsiLength=14 to determine overbought/oversold.
-
Entry logic: Go long if close > TRAMA and close breaks above upper trendline, if no entry last month.
-
Exit logic: Close long if RSI > 70 (overbought).
-
Plot TRAMA line and RSI overbought level 70.
The strategy combines 3 major technical indicators to find low risk long entries once per month. Entries are limited to trend breaks only, avoiding whipsaws in ranges.
Advantages
-
Combines multiple indicators for robust market analysis and higher accuracy.
-
Limits entries to monthly timeframe, avoiding overtrading.
-
Adaptive MA quickly adapts to trend changes.
-
Oversold RSI avoids buying at market tops and controls risk.
-
Simple entry/exit rules are easy to implement.
-
Customizable parameters allow strategy optimization.
Risks
-
Whipsaw risk if breakout fails. Stop loss if price breaks back below trendline.
-
Poor timing leads to entries near tops.
-
Bad indicator parameters cause misleading signals.
-
Breakouts may Reflect recent market volatility. Consider adaptive stops/position sizing.
-
Monitor risk/reward. Consider only trading pullbacks or adding other confirmation filters.
-
Validate indicators on multiple timeframes. Use higher timeframes to identify trend and lower for entry.
-
Backtest over different market conditions. Optimize parameters to match strategy to market type.
Optimization
-
Add volume indicator to avoid false breakouts with low volume.
-
Consider partial profit taking on RSI overbought exit, keeping partial position.
-
Optimize MA parameters to better adapt to trend changes.
-
Add zones before/after breakout point to avoid buying right at reversal.
-
Add more filters like channels, volatility for higher accuracy.
-
Scale in with additional breakouts at new resistance levels.
Conclusion
The Monthly Trend Breakout Strategy analyzes trend, momentum and extremes. It determines trend on monthly timeframe but enters on shorter timeframe breakouts. RSI oversees risk management. Simple logic identifies optimized monthly long entries. It balances trend following and risk controls. Parameter optimization adapts it to different market conditions. Overall, this is a simple yet robust strategy combining usability and effective risk management.
/*backtest
start: 2022-10-17 00:00:00
end: 2023-10-23 00:00:00
period: 1d
basePeriod: 1h
exchanges: [{"eid":"Futures_Binance","currency":"BTC_USDT"}]
*/

//@version=5
strategy('Bannos Strategy', shorttitle='Bannos', overlay=true)

//The provided script is an indicator for TradingView written in Pine Script version 5. The indicator is used to determine entry and exit points for a trading strategy. Here's a detailed breakdown of what the script does:- 1