Stochastic Momentum Breakout Strategy

Overview
The Momentum Breakout strategy mainly uses the Stochastic oscillator indicator to determine the market trend direction, combined with the ADX indicator to judge the trend strength, to generate trading signals. This strategy is mainly suitable for medium-to-long term trend trading.
Strategy Logic
The strategy is based on two technical indicators:
-
Stochastic oscillator: used to determine the market trend direction. The Stochastic oscillator value ranges from 0 to 100. A value between 45 and 55 when the period is 14 means no clear trend. A Stochastic above 55 is a bullish signal and below 45 is a bearish signal.
-
ADX indicator: used to judge the trend strength. An ADX below 20 indicates a weak trend.
The strategy first judges if there is a clear uptrend or downtrend based on the Stochastic oscillator value. When the Stochastic is above 55, it signals an uptrend. When it's below 45, it signals a downtrend.
It then checks if the ADX is above 20 to confirm a strong trend. If ADX is above 20, it means the trend is strong enough for trend trading. If ADX is below 20, the trend is considered not obvious and no trading signals will be generated.
By combining the Stochastic oscillator and ADX, trading signals are generated when both of the following conditions are met:
- Stochastic above 55, signaling an uptrend.
- ADX above 20, confirming the uptrend is strong.
Sell signals are generated when both of these conditions are met:
- Stochastic below 45, signaling a downtrend.
- ADX above 20, confirming the downtrend is strong.
With these rules, the strategy forms a medium-to-long term trend following system.
Advantages
The advantages of this strategy include:
-
Catching mid-to-long term trends: By combining Stochastic and ADX, it can effectively determine the market trend direction and strength, catching the major trends.
-
Drawdown control: Only trading when the trend is clear can help control unnecessary whipsaws.
-
Parameter tuning: The periods of Stochastic and ADX can be optimized for different markets.
-
Simplicity: The overall logic is simple and intuitive, consisting of two common technical indicators.
-
Universality: The strategy can be applied to different markets with parameter tuning.
Risks
Some risks of the strategy:
-
Missing breakout points: As trend following indicators, Stochastic and ADX may miss potential trend reversal points and early breakout trades.
-
Trend reversal risks: They may wrongly judge the trend to be continuing near the end of a trend, missing chances to exit timely, leading to amplified losses.
-
Difficulty in parameter optimization: The parameters need to be tuned for different markets, which poses some difficulty.
-
Whipsaws: It may generate multiple invalid signals in range-bound markets without a clear trend.
-
Divergence: When the price trend conflicts with the Stochastic oscillator trend, divergence emerges, which may lead to losing trades.
The risks could be mitigated by:
-
Adding other indicators to identify local trends and potential breakout points.
-
Incorporating trend reversal signals to exit timely when trends substantially reverse.
-
Using machine learning to automatically optimize parameters.
-
Increasing the ADX threshold to filter out weak trend signals in ranging markets.
-
Applying additional indicators to confirm the Stochastic signals and avoid divergence trades.
Improvement Directions
Some ways to improve the strategy:
-
Optimizing Stochastic parameters like the K and D periods to locate turning points accurately.
-
Optimizing the ADX period to determine the best parameters for judging trend strength.
-
Adding trend reversal signals such as increasing position size in Stochastic overbought/oversold zones with stop loss.
-
Combining other indicators like RSI and MACD to refine entry and exit timing.
-
Using machine learning to find the optimal parameter combinations.
-
Implementing stop loss strategies like moving stop loss or reverse stop loss to control single trade loss.
-
Trailong stop loss: Add trailing stop loss to lock in profits as the trend extends.
-
Money management: Optimize the risk management by adjusting position sizing based on ADX strength.
Summary
In summary, this Momentum Breakout strategy is overall a trend-following system, using Stochastic to determine the trend direction and ADX to gauge the strength, forming a medium-to-long term trading strategy. The advantages lie in catching trends and controlling drawdowns with a simple and intuitive logic. The weaknesses are potential missed early breakout trades and trend reversal risks. We can optimize it through methods like parameter tuning, adding signals, implementing stop loss to improve reward/risk while controlling risks.
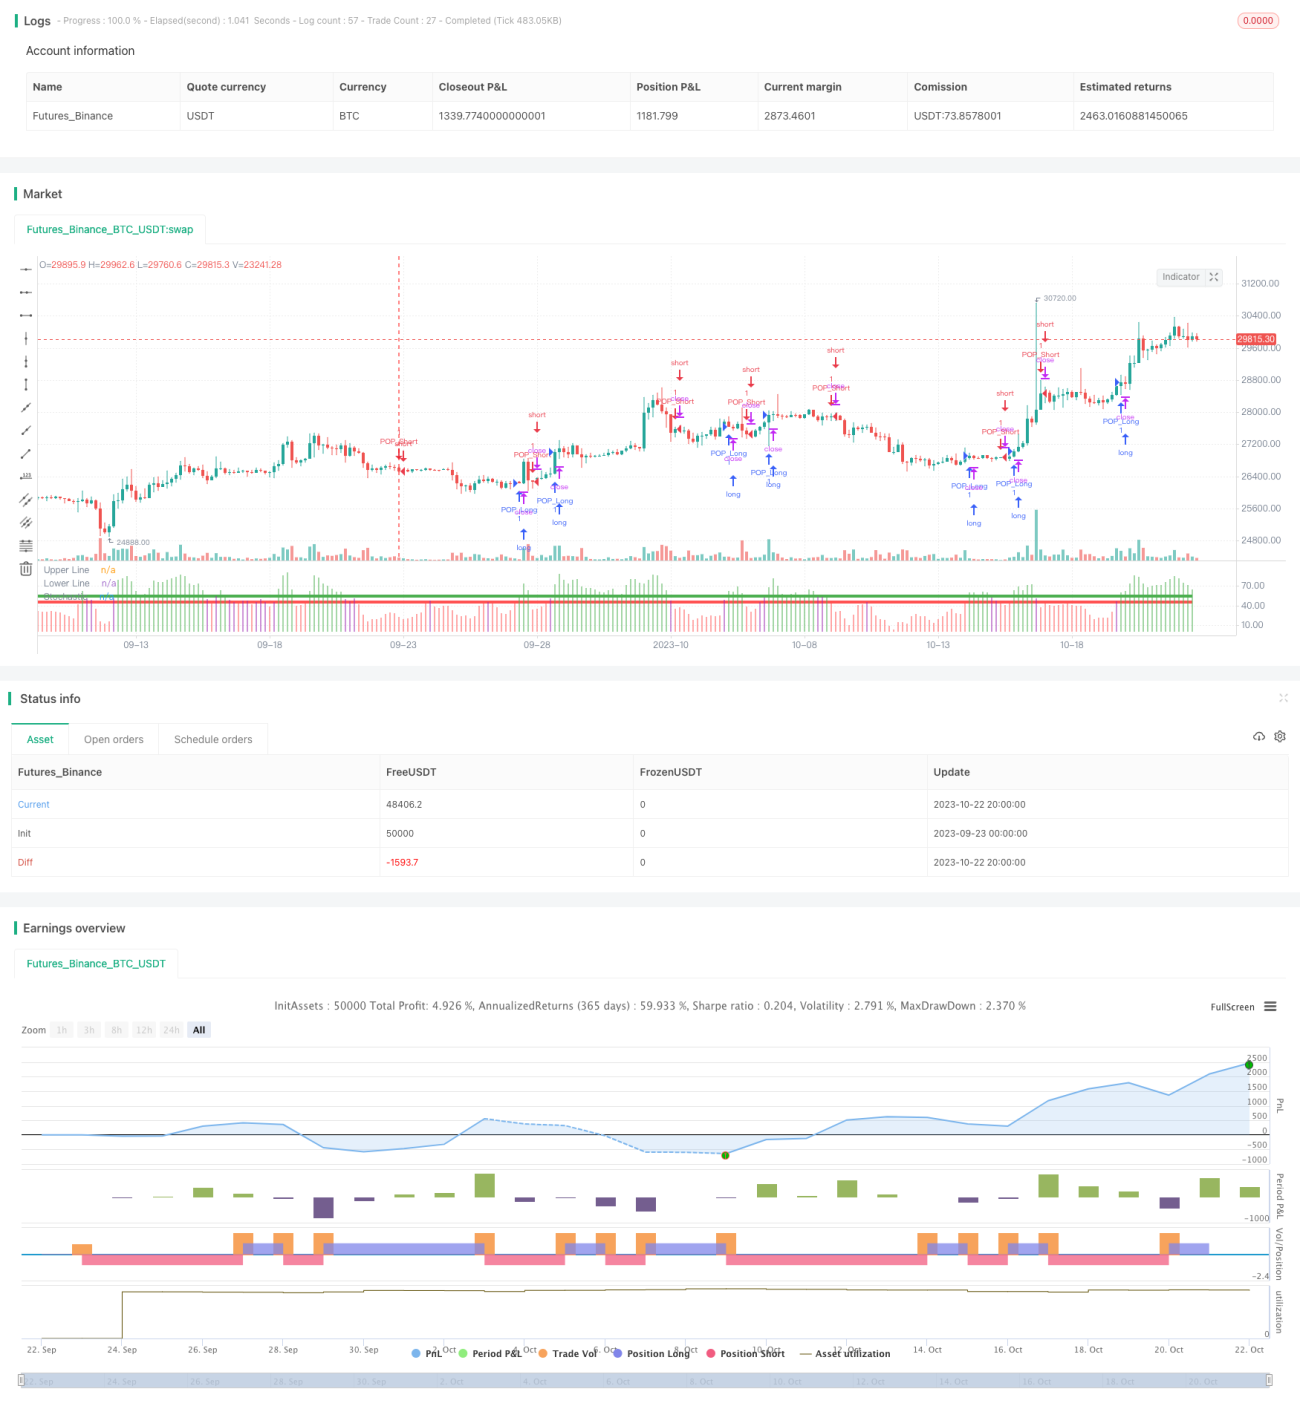
/*backtest
start: 2023-09-23 00:00:00
end: 2023-10-23 00:00:00
period: 4h
basePeriod: 15m
exchanges: [{"eid":"Futures_Binance","currency":"BTC_USDT"}]
*/

//Created by Bitcoinduke
//Original Creator is Jake Bernstein
// Link: https://school.stockcharts.com/doku.php?id=trading_strategies:stochastic_pop_drop
// Tested: XBTUSD 3h | BTCPERP FTX 3h- 1