Bull and Bear Power Backtest Strategy

Overview
The Bull and Bear Power strategy was developed by Dr. Alexander Elder using the Elder-ray indicator to measure buying and selling pressure in the market. The Elder-ray is often used with the Triple Screen system but can also be used on its own.
Dr. Elder uses a 13-period exponential moving average (EMA) to indicate the market consensus of value. Bull power measures the ability of buyers to drive prices above the consensus of value. Bear power reflects the ability of sellers to drive prices below the average consensus of value.
Bull power is calculated by subtracting the 13-period EMA from the high. Bear power subtracts the 13-period EMA from the low.
Strategy Logic
The strategy judges market sentiment through calculating bull and bear power indicators.
- Calculate 13-period EMA as market value consensus
- Calculate bull power: High minus 13-period EMA
- Calculate bear power: Low minus 13-period EMA
- Compare bull power and bear power with threshold to determine long and short signals
- Option to trade reverse signals
When bull power is greater than threshold, it's long signal. When bear power is greater than threshold, it's short signal. Reverse trading can be selected.
Advantage Analysis
- Simple and intuitive using bull and bear power indicators to judge market sentiment
- Flexible configuration of parameters, adjustable threshold and period
- Option for reverse trading adapts to different market environments
- Uses exponential moving average, less sensitive to outliers
Risk Analysis
- Prone to false signals, needs combining with trend and other filters
- Fixed period cannot adapt to market changes, adaptive period can optimize
- No stop loss, easily chasing market with huge losses
- Only judges long or short, lacks timing selection
Can add stop loss, optimize moving average period, combine with trend filter etc.
Optimization Directions
- Optimize moving average period, use adaptive period EMA
- Add trend filter to avoid counter trend trading
- Add stop loss to control single trade loss
- Combine other indicators to select better entry timing
- Utilize machine learning to optimize parameters
Conclusion
The Bull and Bear Power strategy judges market sentiment simply and intuitively with configurable parameters. But it's prone to false signals and needs further optimization with trend and stop loss. The logic is worth learning but direct application needs caution.
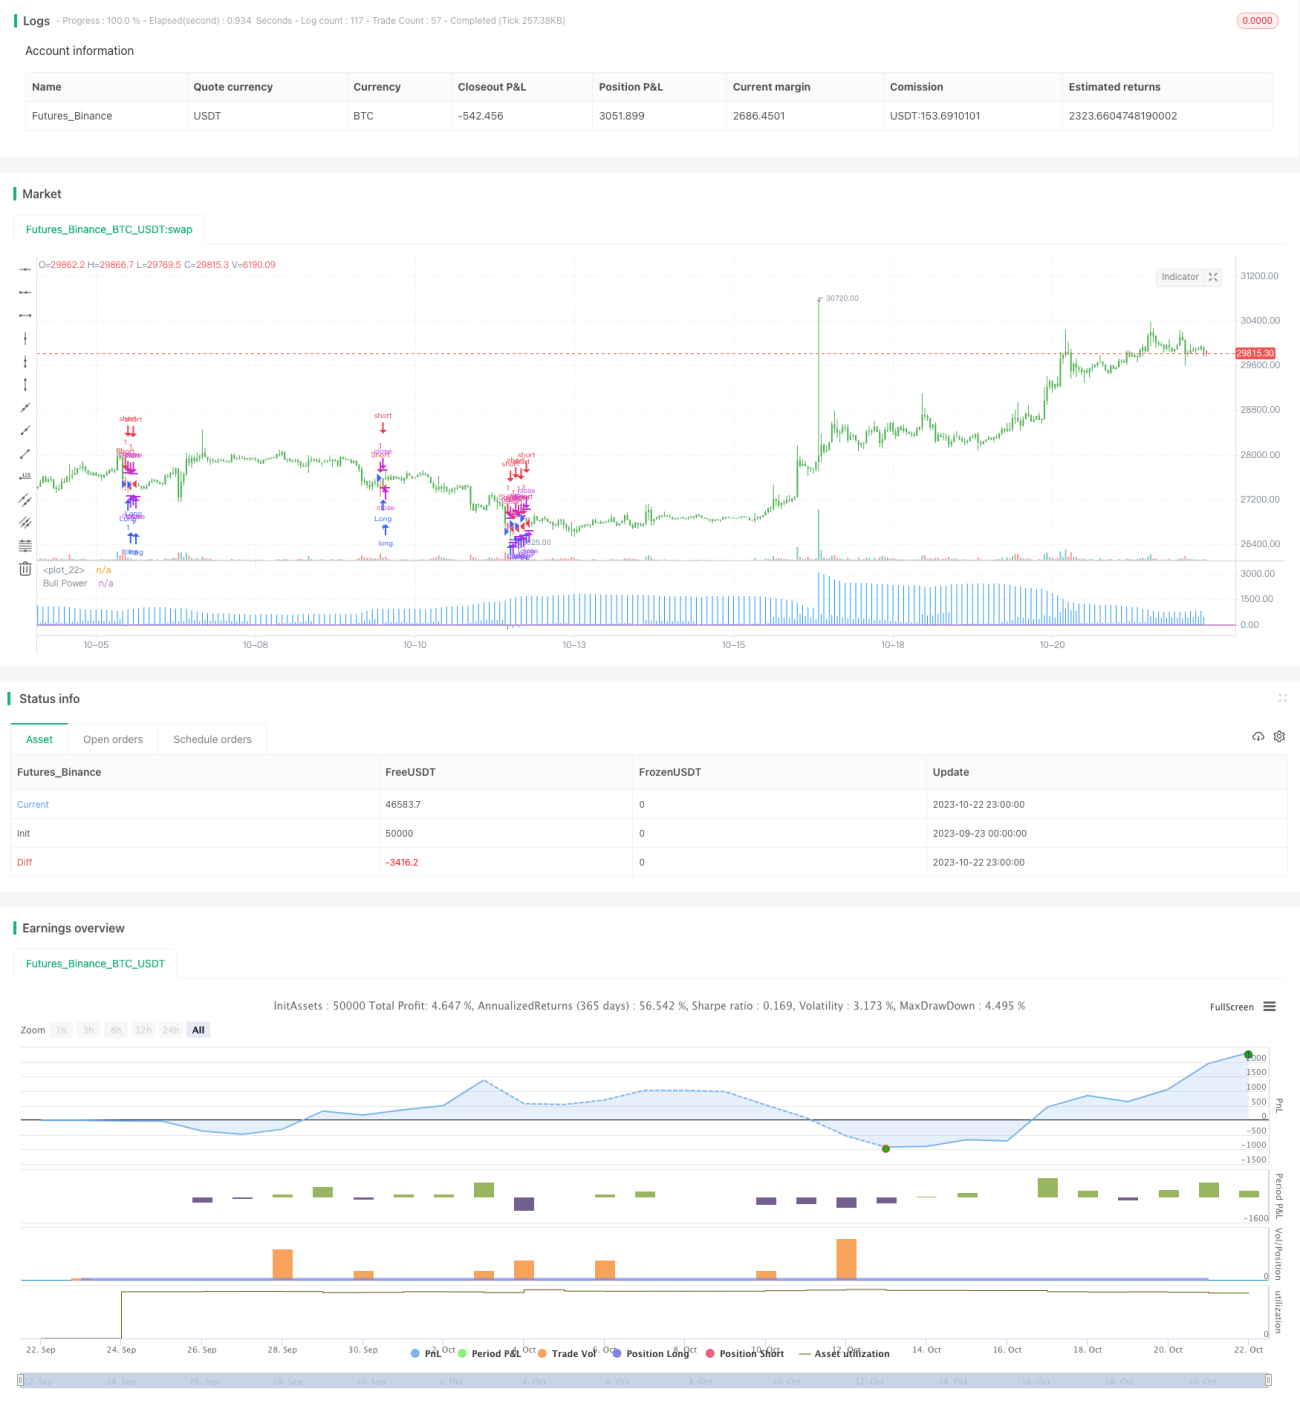
/*backtest
start: 2023-09-23 00:00:00
end: 2023-10-23 00:00:00
period: 1h
basePeriod: 15m
exchanges: [{"eid":"Futures_Binance","currency":"BTC_USDT"}]
*/

//@version = 2
////////////////////////////////////////////////////////////
//  Copyright by HPotter v1.0 08/12/2016
// Developed by Dr Alexander Elder, the Elder-ray indicator measures buying - 1