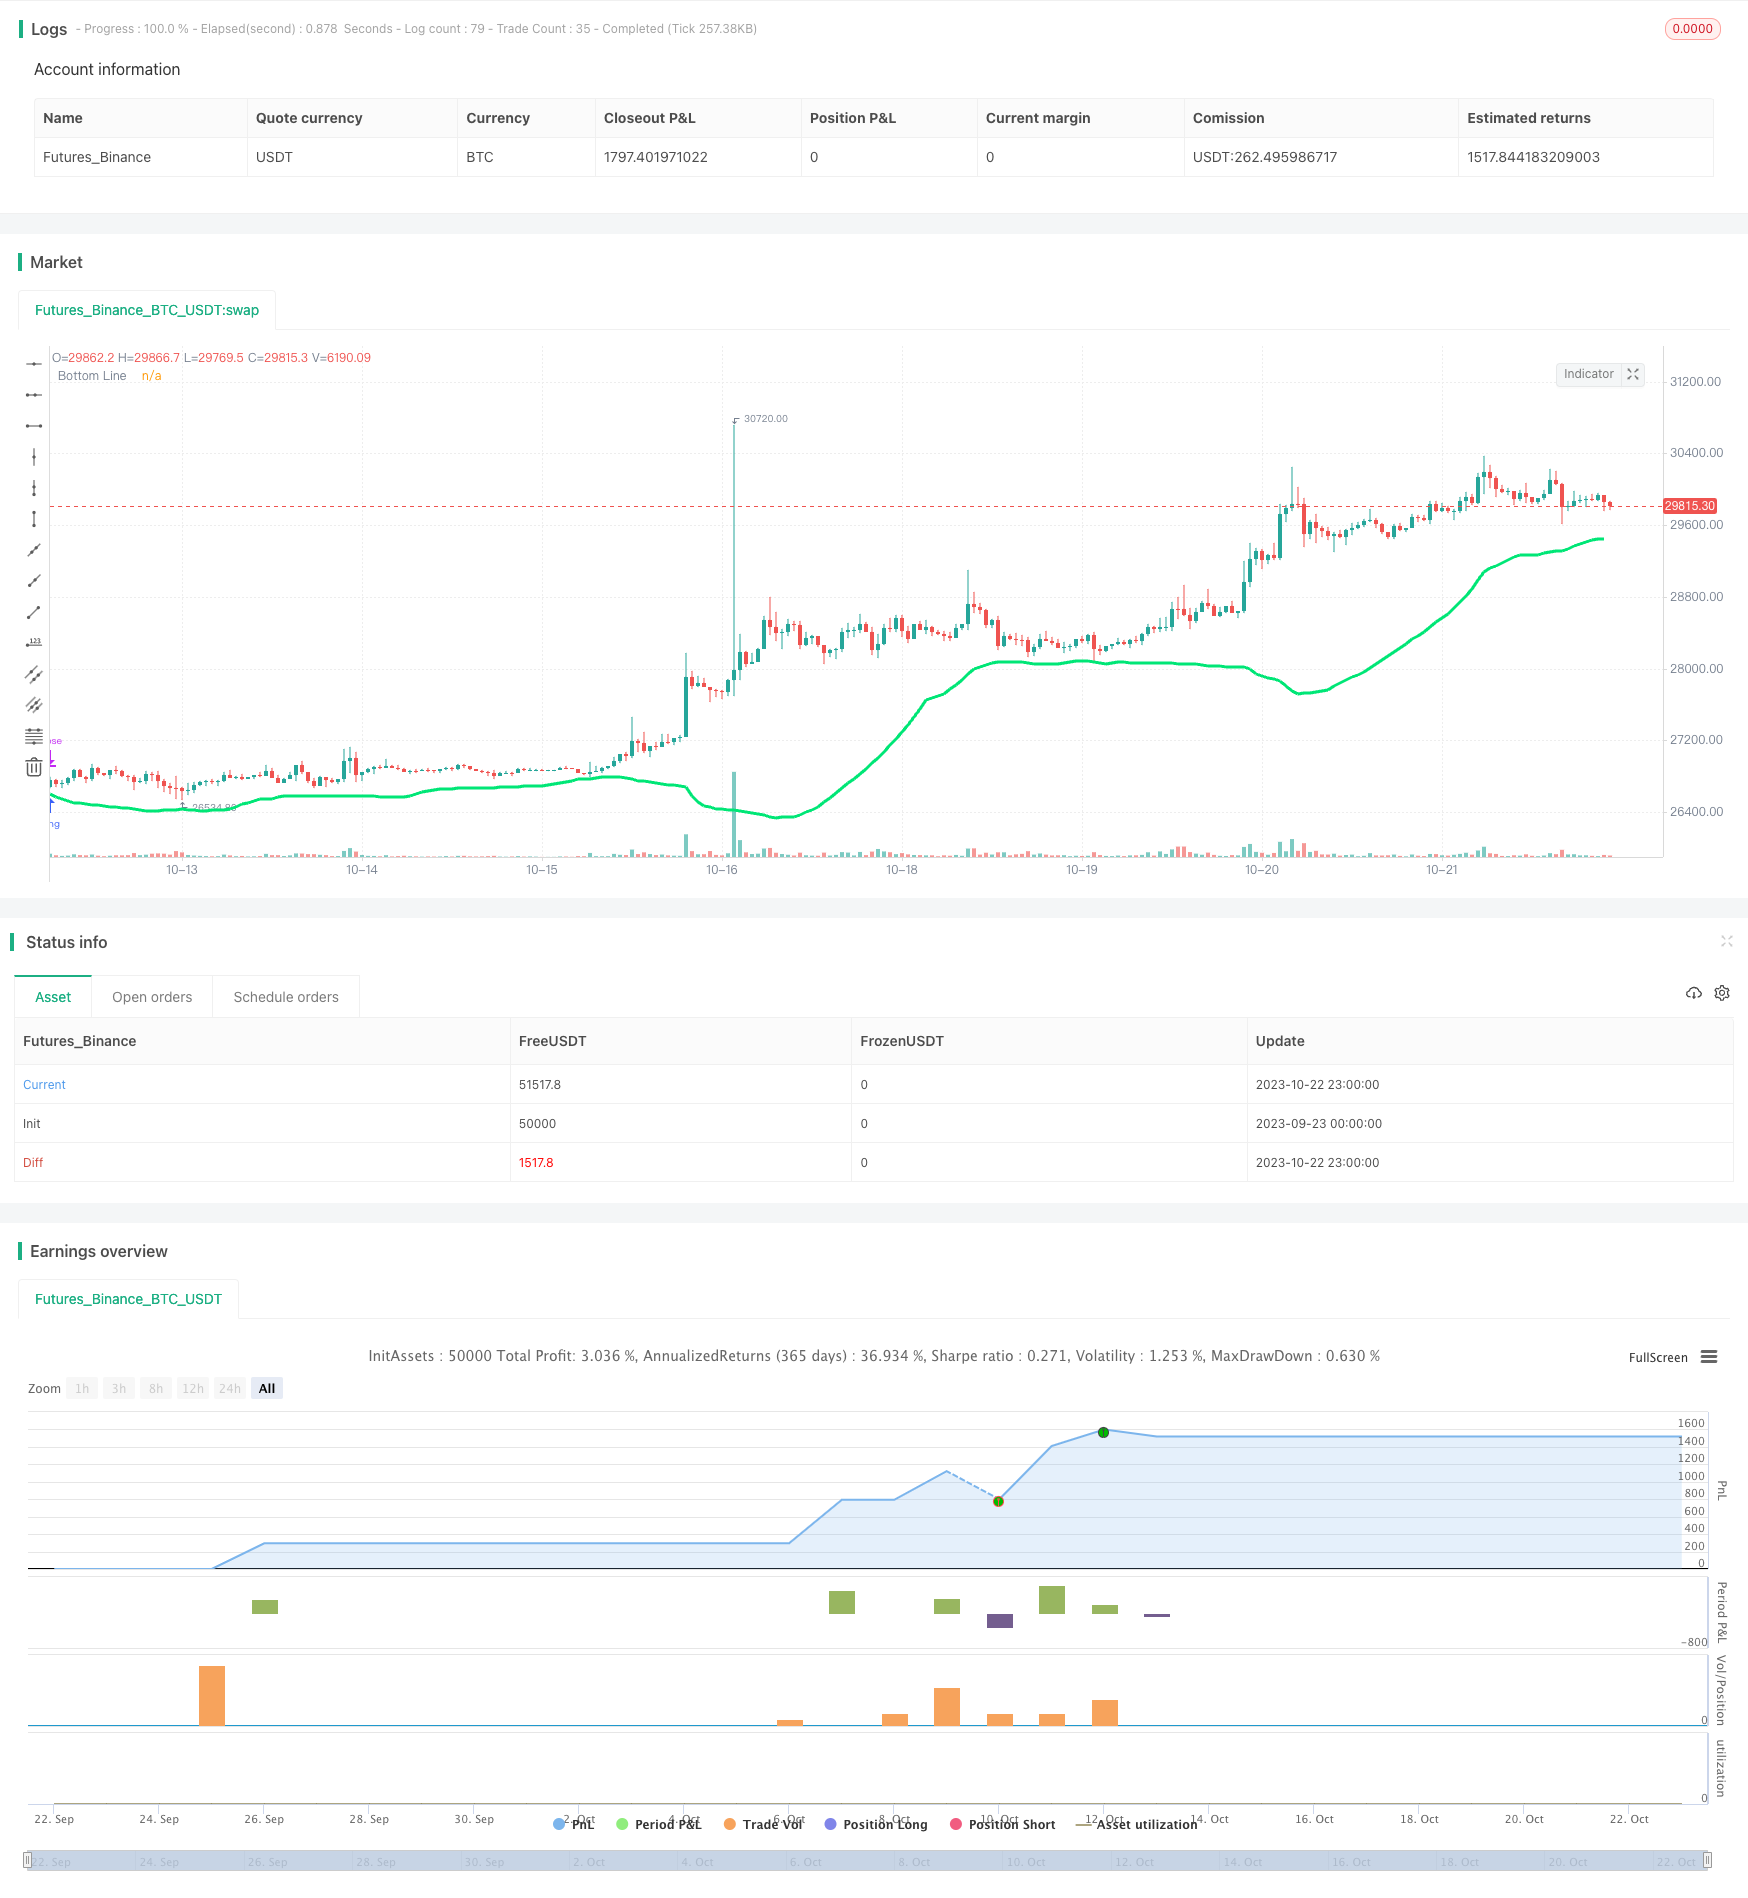
概述
该策略利用布林带指标进行趋势判断,并结合RSI指标避免过度买入,以及蜡烛实体过滤和颜色过滤来进一步验证交易信号。总体来说,该策略的主要思想是在趋势开始阶段买入,并在趋势反转前退出,以获利收场。
原理
该策略首先利用布林带指标中的下轨线,当价格低于下轨时视为仪态头寸的机会。为避免过度买入,策略还引入RSI指标,要求RSI小于30才产生买入信号。此外,策略还设置蜡烛实体过滤,要求当前K线的实体大于过去10根K线平均实体的一半才会触发买入。最后,颜色过滤要求蜡烛为绿色(收阳),以进一步验证买入时机。
当价格上穿布林带下轨、RSI小于30、实体充分、为绿色K线时产生买入信号。而当价格收盘高于开盘、实体大于平均实体的一半时,为趋势反转信号,此时平仓止盈。
优势分析
该策略最大的优势在于能够成功判断趋势开始的时机进入场内,并在趋势反转前退出,从而获利潜力较大。具体来说,主要优势有:
布林带指标判断趋势方向准确。布林带通过拟合价格波动范围来判断价格走势,使用该指标能够有效判定趋势开始和结束。
RSI指标避免过度买入。RSI可以衡量超买超卖情况,结合RSI可以避免在价格短期调整时错买进场。
实体过滤增加信号的可靠性。较大的蜡烛实体代表着更强劲的突破,实体过滤可以确保买入强劲的突破。
颜色过滤确认买入时机。只在K线为绿色时买入,可以再次验证买入时机的正确性。
买入后通过蜡烛转绿判断趋势反转。交易者常说“趋势是轮流的”,通过蜡烛转绿可以及时判断到趋势反转的时机。
风险分析
该策略也存在一些风险需要注意:
布林带指标发出错误信号的可能。当市场震荡时,布林带也可能产生错误的突破信号。
未考虑止损导致亏损扩大。该策略未设置止损,如果判断错误可能导致较大亏损。
过滤条件过于严格错过买入时机。多个过滤条件叠加使用时,可能会错过买入机会。
依赖参数优化和回测效果。参数和过滤条件的设置需要优化和验证,实盘效果也需要验证。
蜡烛转绿判定趋势反转不稳定。K线转绿并不能完全确定趋势反转。
对应策略的风险,可以设置止损来控制损失;优化过滤条件,降低错过买入的概率;采用多种指标验证买入时机,提高成功率。此外,也需要在实盘中验证回测结果。
优化方向
该策略可以从以下几个方面进行优化:
优化布林带的参数,寻找最佳的参数组合。可以测试不同的周期长度、标准差倍数等。
测试不同的超买超卖指标替代RSI。例如KDJ、威廉指标等。
添加移动止损来控制风险。根据回测数据设定合理的移动止损策略。
优化过滤条件参数。测试不同大小的蜡烛实体过滤和周期参数。
尝试结合其它指标验证信号。例如量价 Confirmation等指标。
测试不同的反转信号判定。例如均线交叉等信号来判断趋势反转。
对交易品种、时间段进行测试。评估策略在不同市场中的效果。
总结
该策略整体来说具有较强的趋势跟踪能力和适应性。核心优势在于利用布林带判断趋势方向以及 RSI 和过滤条件确保买入时机。但是也存在一定的风险,需要针对性地进行优化测试。若能够验证参数和规则,有望获取较好的实盘效果。总体来说,该策略具有一定的实用价值。
/*backtest
start: 2023-09-23 00:00:00
end: 2023-10-23 00:00:00
period: 1h
basePeriod: 15m
exchanges: [{"eid":"Futures_Binance","currency":"BTC_USDT"}]
*/

//Noro
//2018

//Donate: 3BMEXvKkuJLobJrcpMm12bKTZoCnojZTjh

//@version=2
strategy(title = "Noro's Wizard Strategy v1.1", shorttitle = "Wizard str 1.1", overlay = true, default_qty_type = strategy.percent_of_equity, default_qty_value = 100, pyramiding = 10)

//Settings
capital = input(100, defval = 100, minval = 1, maxval = 10000, title = "Capital, %")
length = input(40, defval = 40, minval = 1, maxval = 200, title = "BB Period")
usebod = input(false, defval = false, title = "Use Body-Filter")
usecol = input(false, defval = false, title = "Use Color-Filter")
usersi = input(true, defval = true, title = "Use RSI-Filter")
showar = input(false, defval = false, title = "Show Arrows")
fromyear = input(1900, defval = 1900, minval = 1900, maxval = 2100, title = "From Year")
toyear = input(2100, defval = 2100, minval = 1900, maxval = 2100, title = "To Year")
frommonth = input(01, defval = 01, minval = 01, maxval = 12, title = "From Month")
tomonth = input(12, defval = 12, minval = 01, maxval = 12, title = "To Month")
fromday = input(01, defval = 01, minval = 01, maxval = 31, title = "From day")
today = input(31, defval = 31, minval = 01, maxval = 31, title = "To day")

//Bollinger
src = low
mult = 2
basis = sma(src, length)
dev = mult * stdev(src, length)
lower = basis - dev
plot(lower, color = lime, linewidth = 3, title="Bottom Line")

//Fast RSI Filter
fastup = rma(max(change(close), 0), 7)
fastdown = rma(-min(change(close), 0), 7)
rsi = fastdown == 0 ? 100 : fastup == 0 ? 0 : 100 - (100 / (1 + fastup / fastdown))
rsif = rsi < 30 or usersi == false

//Body Filter
nbody = abs(close - open)
abody = sma(nbody, 10)
body = nbody > abody / 2 or usebod == false

//Signals
up1 = low < lower and (close < open or usecol == false) and body and rsif
exit = close > open and nbody > abody / 2

//Arrows
needar = up1 and showar
plotarrow(needar ? 1 : na)

//Trading
lot = strategy.position_size == 0 ? strategy.equity / close * capital / 100 : lot[1]

if up1
    if strategy.position_size < 0
        strategy.close_all()

    strategy.entry("Long", strategy.long, lot, when=(time > timestamp(fromyear, frommonth, fromday, 00, 00) and time < timestamp(toyear, tomonth, today, 23, 59)))

if time > timestamp(toyear, tomonth, today, 23, 59) or exit
    strategy.close_all()