概述
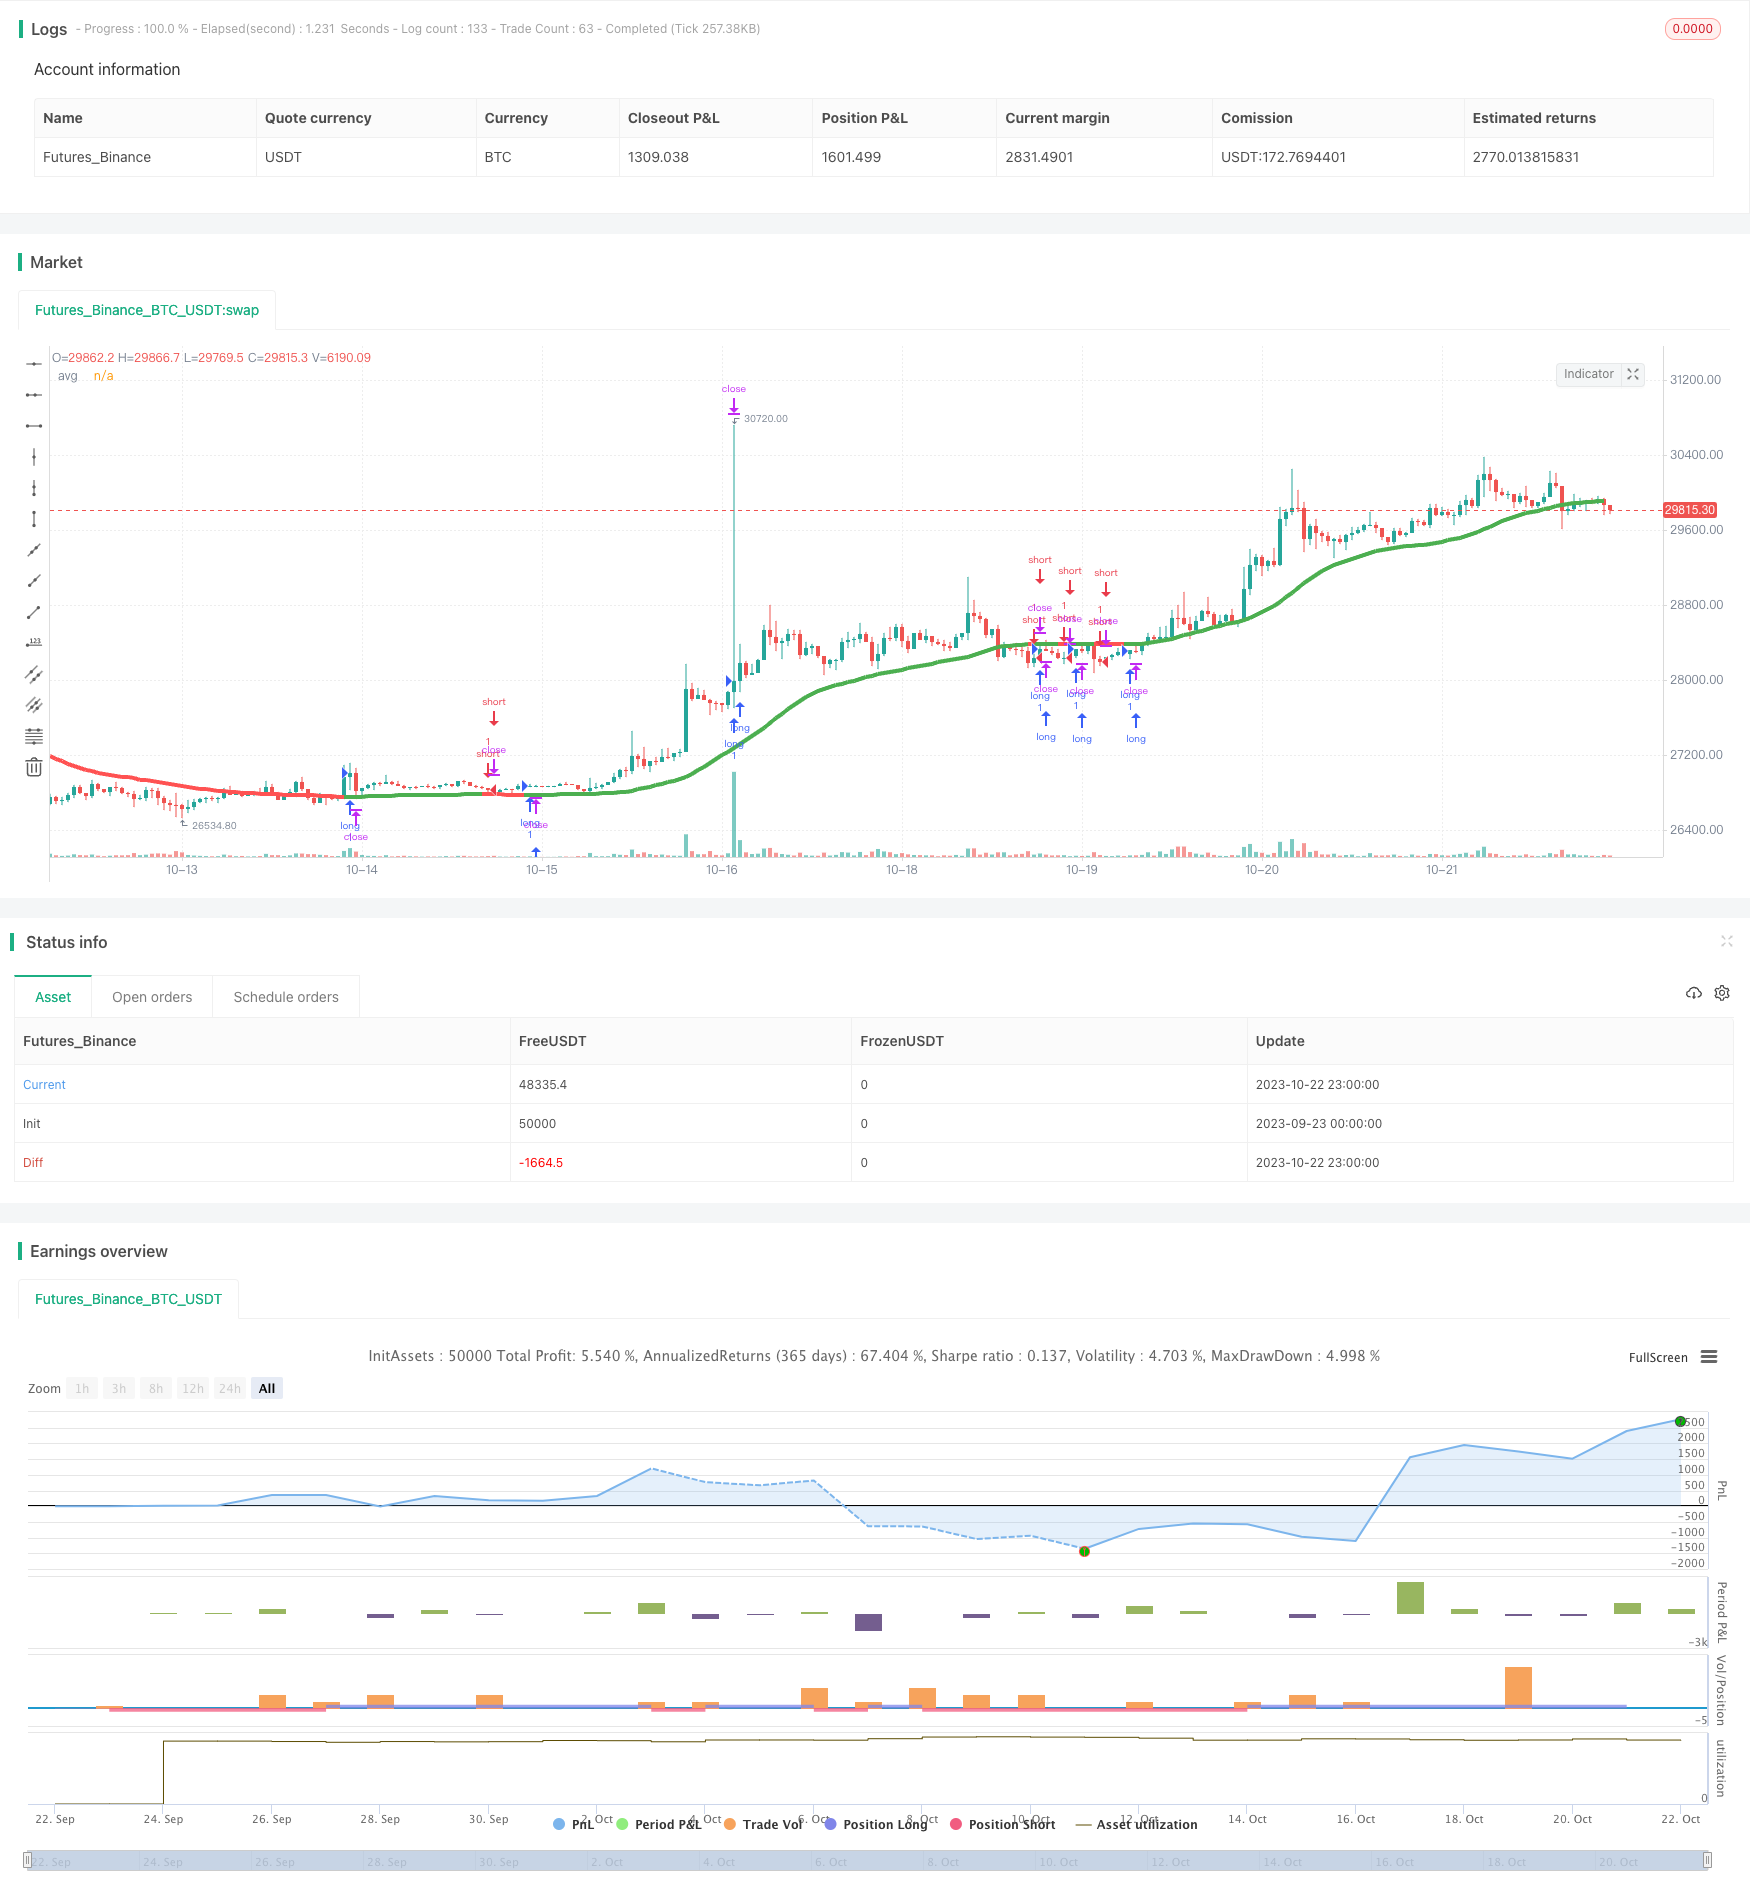
本策略结合Hull移动平均线和T3移动平均线的优点,设计了一个跨市交易的策略。该策略既可用于短线交易,也可用于中长线趋势跟踪。通过计算Hull移动平均线和T3移动平均线的均值作为主要的交易信号线,根据其方向的变化来判断入场和出场时机。
策略原理
该策略主要基于Hull移动平均线和T3移动平均线的计算。
Hull移动平均线(Hull Moving Average,HMA)通过加权移动平均线的迭代计算方法,能有效滤波市场噪音,显示出价格趋势的平滑曲线。它比简单移动平均线和指数移动平均线对价格变化更敏感,同时也能有效抑制假突破。
T3移动平均线在减少滞后效应的同时,通过一定的超参数调整,可以使得移动平均线更贴近价格。它通过多次的指数平滑计算,能够更快速地响应价格变化。
本策略计算出两者的平均值,作为主要的交易指标。根据该平均线的方向判断入场时机:如果当前周期的平均线高于上一周期,则为多头入场信号;如果当前周期的平均线低于上一周期,则为空头入场信号。
对于出场规则,如果价格突破止损点或者达到止盈点,则出场;如果平均线方向发生转变,也执行出场动作。
优势分析
该策略结合了Hull移动平均线和T3移动平均线的优点,既能平滑去噪,也能快速响应价格变化,从而生成一个综合性指标。其次,该策略同时适用于短线和中长线交易,通过调整计算周期参数,可以灵活地调整适用的交易周期。再者,该策略采用了移动止损和移动止盈设置,可以锁定盈利,控制风险。
风险分析
该策略主要依赖均线指标,在震荡趋势中可能会产生多次虚假信号。此外,均线具有一定滞后性,可能错过价格 변化的最佳入场时点。设置止损止盈点需要谨慎,避免过于宽松或过于紧迫。最后,不同币种和交易周期需要测试优化参数,不能直接复用。
优化方向
可以考虑加入其他辅助指标,如强弱指标、波动率指标等,来验证均线信号,过滤虚假信号。可以测试不同的均线组合和权重算法,优化生成均线信号的效果。可以加入自适应止损和尾随止盈来动态管理风险。可以针对不同币种和交易周期进行回测优化,找到其最佳参数组合。
总结
本策略整合Hull移动平均线和T3移动平均线的优势,形成一个综合指标来判断趋势方向。通过参数优化,该策略可以灵活适用于不同的交易周期。策略具有一定的优势,但也存在跟随滞后,产生虚假信号等问题。通过加入其他辅助指标,优化参数以及动态止损止盈等手段,可以不断优化改进该策略,以获得更好的效果。
/*backtest
start: 2023-09-23 00:00:00
end: 2023-10-23 00:00:00
period: 1h
basePeriod: 15m
exchanges: [{"eid":"Futures_Binance","currency":"BTC_USDT"}]
*/

// This source code is subject to the terms of the Mozilla Public License 2.0 at https://mozilla.org/MPL/2.0/
// © exlux99

//@version=4


strategy(title="Swing HULL + T3 avg", shorttitle="Swing HULL T3 AVG", overlay=true)

fromDay = input(defval = 1, title = "From Day", minval = 1, maxval = 31)
fromMonth = input(defval = 1, title = "From Month", minval = 1, maxval = 12)
fromYear = input(defval = 2000, title = "From Year", minval = 1970)
 //monday and session
// To Date Inputs
toDay = input(defval = 31, title = "To Day", minval = 1, maxval = 31)
toMonth = input(defval = 12, title = "To Month", minval = 1, maxval = 12)
toYear = input(defval = 2021, title = "To Year", minval = 1970)

startDate = timestamp(fromYear, fromMonth, fromDay, 00, 00)
finishDate = timestamp(toYear, toMonth, toDay, 00, 00)
time_cond = true


////////////////////////////GENERAL INPUTS//////////////////////////////////////

length_Ma= input(defval=50, title="Length MAs", minval=1)

//==========HMA
getHULLMA(src, len) =>
    hullma = wma(2*wma(src, len/2)-wma(src, len), round(sqrt(len)))
    hullma

//==========T3
getT3(src, len, vFactor) =>
    ema1 = ema(src, len)
    ema2 = ema(ema1,len)
    ema3 = ema(ema2,len)
    ema4 = ema(ema3,len)
    ema5 = ema(ema4,len)
    ema6 = ema(ema5,len)
    c1 = -1 * pow(vFactor,3)
    c2 = 3*pow(vFactor,2) + 3*pow(vFactor,3)
    c3 = -6*pow(vFactor,2) - 3*vFactor - 3*pow(vFactor,3)
    c4 = 1 + 3*vFactor + pow(vFactor,3) + 3*pow(vFactor,2)
    T3 = c1*ema6 + c2*ema5 + c3*ema4 + c4*ema3
    T3


hullma = getHULLMA(close,length_Ma)

t3 = getT3(close,length_Ma,0.7)


avg = (hullma+t3) /2


////////////////////////////PLOTTING////////////////////////////////////////////


colorado = avg > avg[1]? color.green : color.red

plot(avg , title="avg", color=colorado, linewidth = 4)

long=avg>avg[1]
short=avg<avg[1]

tplong=input(0.08, title="TP Long", step=0.01)
sllong=input(1.0, title="SL Long", step=0.01)

tpshort=input(0.03, title="TP Short", step=0.01)
slshort=input(0.06, title="SL Short", step=0.01)


if(time_cond)
    strategy.entry("long",1,when=long)
    strategy.exit("closelong", "long" , profit = close * tplong / syminfo.mintick, loss = close * sllong / syminfo.mintick, alert_message = "closelong")

    strategy.entry("short",0,when=short)
    strategy.exit("closeshort", "short" , profit = close * tpshort / syminfo.mintick, loss = close * slshort / syminfo.mintick, alert_message = "closeshort")