Momentum Arbitrage Strategy Backtest Analysis

I. Strategy Name
Based on the key features of this strategy, I name it "Momentum Arbitrage Strategy".
II. Strategy Overview
This strategy generates trading signals by calculating the Chande Momentum Oscillator and setting upper and lower thresholds, forming arbitrage opportunities for profits.
III. Strategy Logic
The code first sets parameters Length, TopBand and LowBand, where Length represents the number of days for momentum calculation, and TopBand and LowBand represent the upper and lower thresholds.
It then calculates the absolute momentum xMom over the past Length days, and the simple moving average of xMom over Length days, xSMA_mom.
After that, it calculates the cumulative momentum over Length days, xMomLength.
Next, it calculates the momentum oscillator nRes, which equals xMomLength divided by xSMA_mom then multiplied by Length, amplified by 100.
Based on the comparison between nRes and the thresholds, it determines long or short direction and stores it in pos.
Finally, it adjusts pos based on whether reverse trading is enabled, generates trading signal possig, and creates long/short entries.
IV. Strategy Strengths
-
Identify potential trend turning points using momentum indicator, benefiting trend catching.
-
Form clear long/short signals combined with threshold filtering, avoiding wrong trades.
-
Apply reverse trading logic to obtain reversal opportunities.
-
Large tunable parameter space, can be optimized for different products and timeframes.
-
Visualized parameters are intuitive, easy to grasp trading logic.
V. Strategy Risks
-
Only consider momentum, may miss opportunities formed by other technical indicators.
-
Momentum breakout does not necessarily represent trend reversal, wrong judgement risk exists.
-
Although reverse trading has profit potential, it may also amplify losses.
-
Improper parameter optimization may lead to over-trading or missing best entry points.
-
Need to filter out short-term momentum distortions caused by sudden events.
Risks can be controlled by combining other indicators like trend and volatility to confirm signal reliability, adjusting parameters to lower trade frequency, relaxing stop loss properly, etc.
VI. Strategy Optimization Directions
- Add other technical indicator filters to improve signal accuracy.
Confirm close price is above moving average system, or volatility is within normal range, before triggered momentum signals.
- Optimize parameters according to product characteristics.
For more volatile products, relax the normal threshold range to lower trade frequency.
- Multi-timeframe optimization based on different time periods.
Use smaller period Length for intraday ultra-short term trading. Adjust parameters based on weekly or monthly charts for medium-long term trends.
- Set bottom divergence condition.
For buy signals, require price to be above previous trough to avoid fake reversal signals.
VII. Conclusion
The strategy mainly identifies short-term trend reversals through momentum indicator, with parameter filtering to generate trade signals, balancing trend following and reversal capturing. The risks are controllable. Further research and application with multi-timeframe optimization and combining other technical indicators can improve strategy performance.
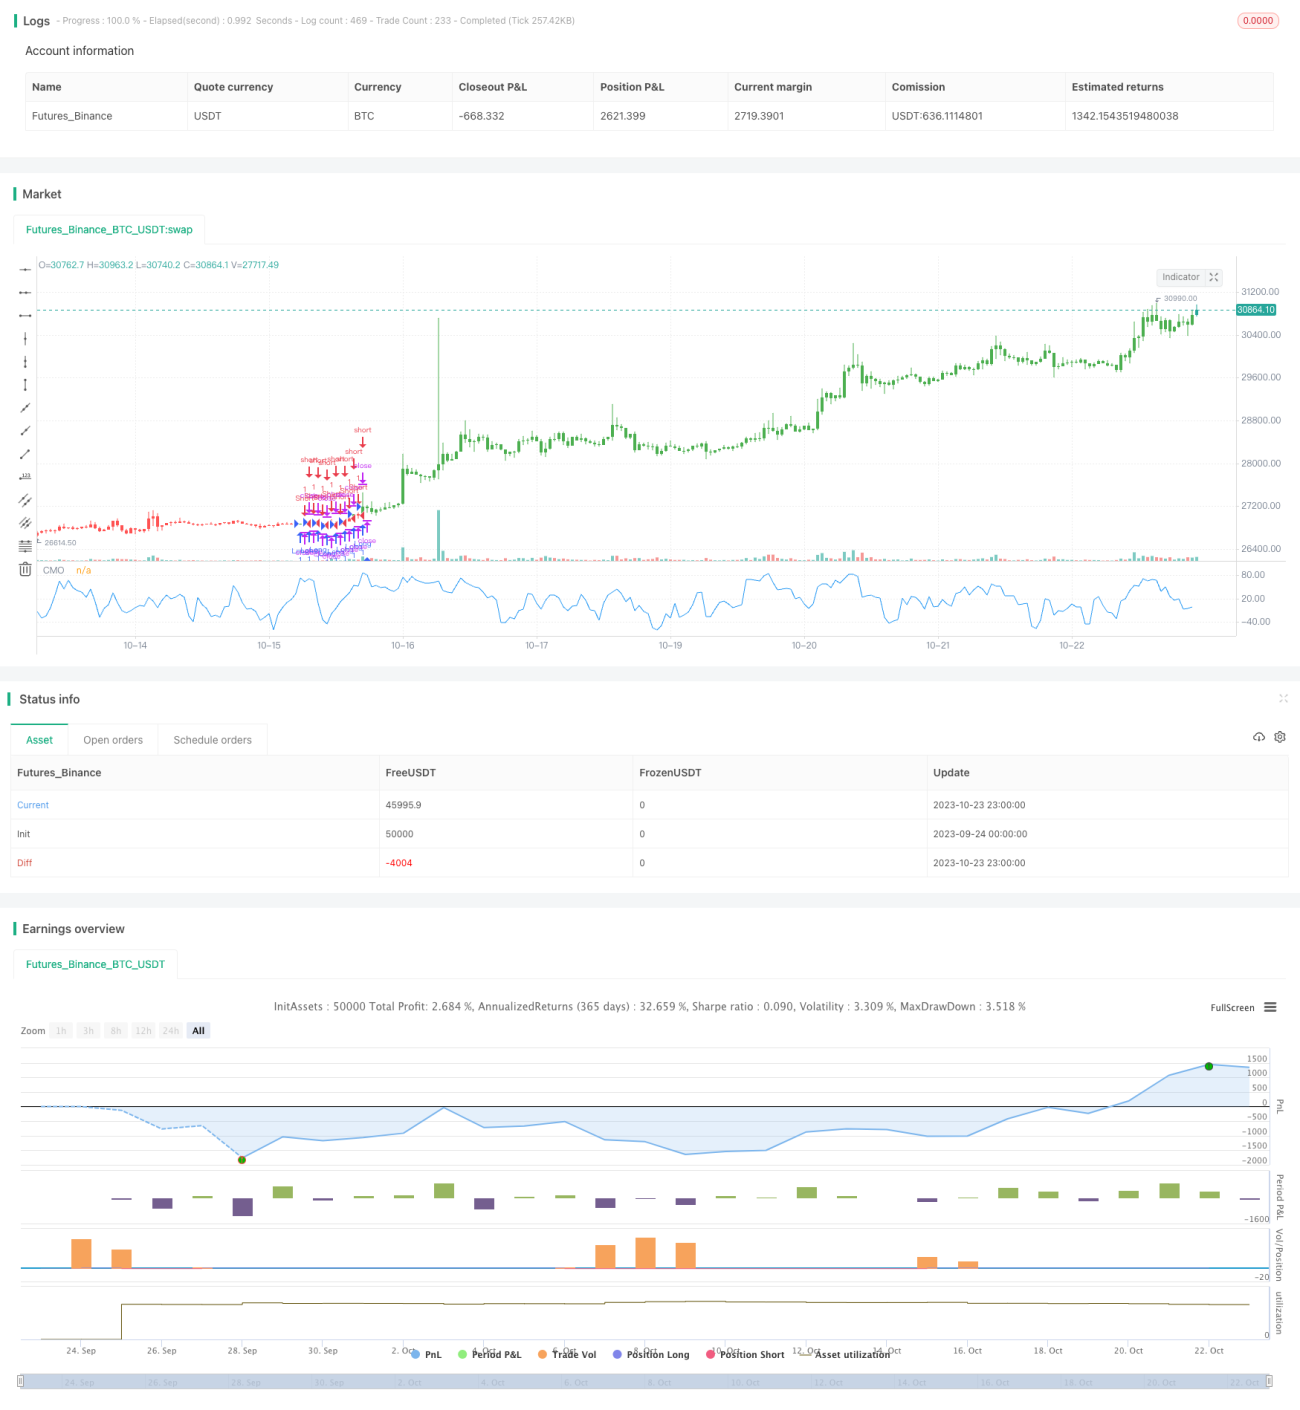
/*backtest
start: 2023-09-24 00:00:00
end: 2023-10-24 00:00:00
period: 1h
basePeriod: 15m
exchanges: [{"eid":"Futures_Binance","currency":"BTC_USDT"}]
*/

//@version=2
////////////////////////////////////////////////////////////
//  Copyright by HPotter v1.0 07/02/2017
// This indicator plots Chande Momentum Oscillator. This indicator was - 1