Trend Following Dual Moving Average Strategy

Overview
This strategy uses the Average Directional Movement Index Rating (ADXR) to identify market trends and combines dual moving averages to generate trading signals. It belongs to a typical trend following strategy. The ADXR indicator can effectively identify changes in trends, and the dual moving averages can further filter out some false signals. This strategy is suitable for trending markets such as stocks and forex to gain better returns in range-bound markets.
Strategy Logic
-
Calculate the ADXR indicator value. ADX reflects the strength of the trend; ADXR smoothes ADX and better displays the trend.
-
Set dual thresholds for the ADXR indicator. When ADXR crosses above the first threshold, it indicates an uptrend. When it crosses below the second threshold, it indicates a downtrend.
-
Determine position direction based on ADXR signals. Go long when ADXR crosses above the first threshold, and go short when it crosses below the second threshold.
-
Filter signals with dual moving averages. Go long only when price is above the fast MA, and go short only when price is below the slow MA. This filtering avoids wrong trades during trend reversals.
-
Color the candlesticks based on position direction. Long positions are in green, short positions are in red.
Advantage Analysis
-
ADXR smoothes price fluctuations and effectively identifies trends, avoiding trading risks from ranging markets.
-
Dual moving average filtering reduces drawdowns by avoiding losses from trend reversals.
-
Combining a trend indicator and moving averages ensures trading along trends while controlling risks, suitable for trending markets.
-
The strategy logic is simple and flexible for parameter tuning for different market environments.
Risk Analysis
-
Improper ADXR parameters may fail to timely capture trend changes. Parameters should be carefully set according to the specific market.
-
Improper moving average parameters may filter too many valid signals. Parameters should be adjusted per market conditions.
-
Any indicator may give wrong signals. Larger timeframe trends should be considered to avoid traps.
-
Reduce position sizing in ranging markets to limit losses.
Optimization Directions
-
Other indicators like MACD and Bollinger Bands can be added to confirm ADXR signals and improve accuracy.
-
Stop loss strategies like trailing stops and time stops can be added to limit per trade loss.
-
Optimize parameters based on market efficiency, like longer averaging periods for low efficiency markets.
-
Incorporate money management strategies like fixed fractional position sizing to better control overall risks.
Conclusion
This strategy is a typical trend following strategy, using ADXR to determine trend direction and dual moving averages to reduce drawdowns. The advantages lie in its simplicity and flexibility to be adapted for different markets. But any technical indicator can give false signals, and risks should be managed with trend filters and money management. With proper parameter tuning, this strategy can achieve good risk-adjusted returns for trending markets.
/*backtest
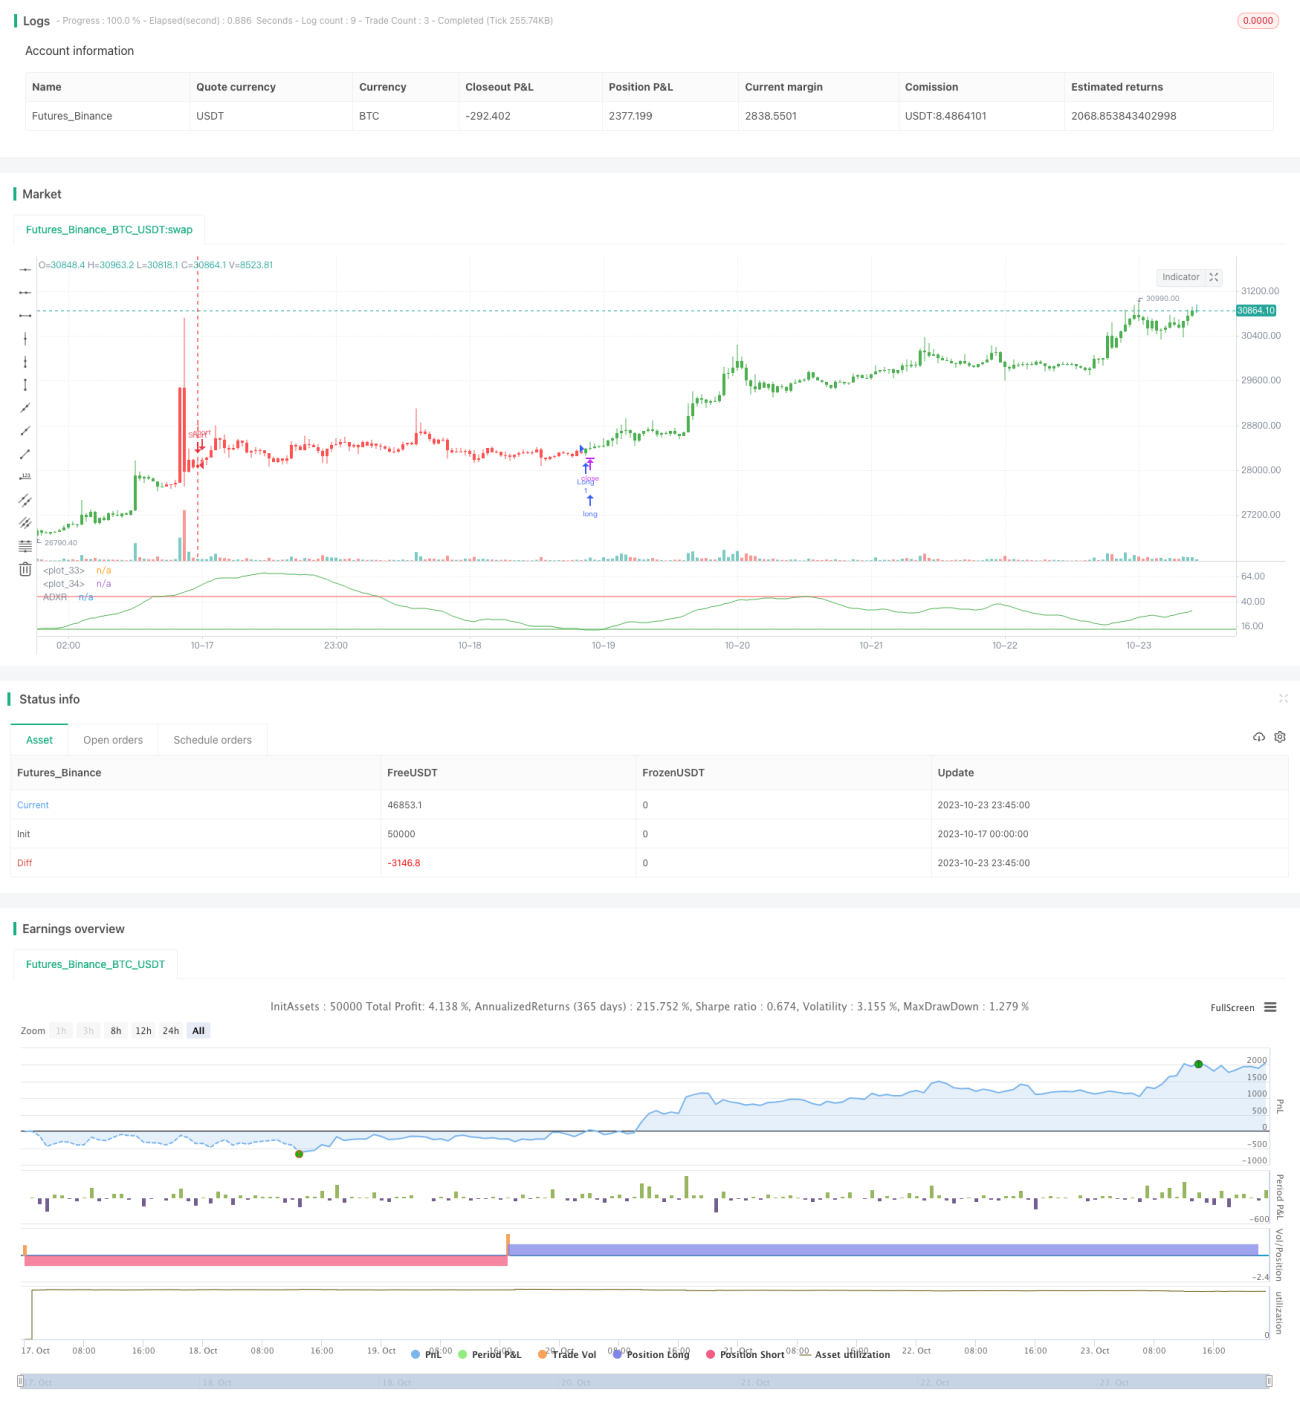
start: 2023-10-17 00:00:00
end: 2023-10-24 00:00:00
period: 45m
basePeriod: 5m
exchanges: [{"eid":"Futures_Binance","currency":"BTC_USDT"}]
*/
//@version=2
////////////////////////////////////////////////////////////
// Copyright by HPotter v1.0 04/05/2018
// The Average Directional Movement Index Rating (ADXR) measures the strength - 1