Bollinger Bands and RSI indicators strategy

Author: ChaoZhang, Date: 2023-10-25 14:47:21
Tags:

img

Overview

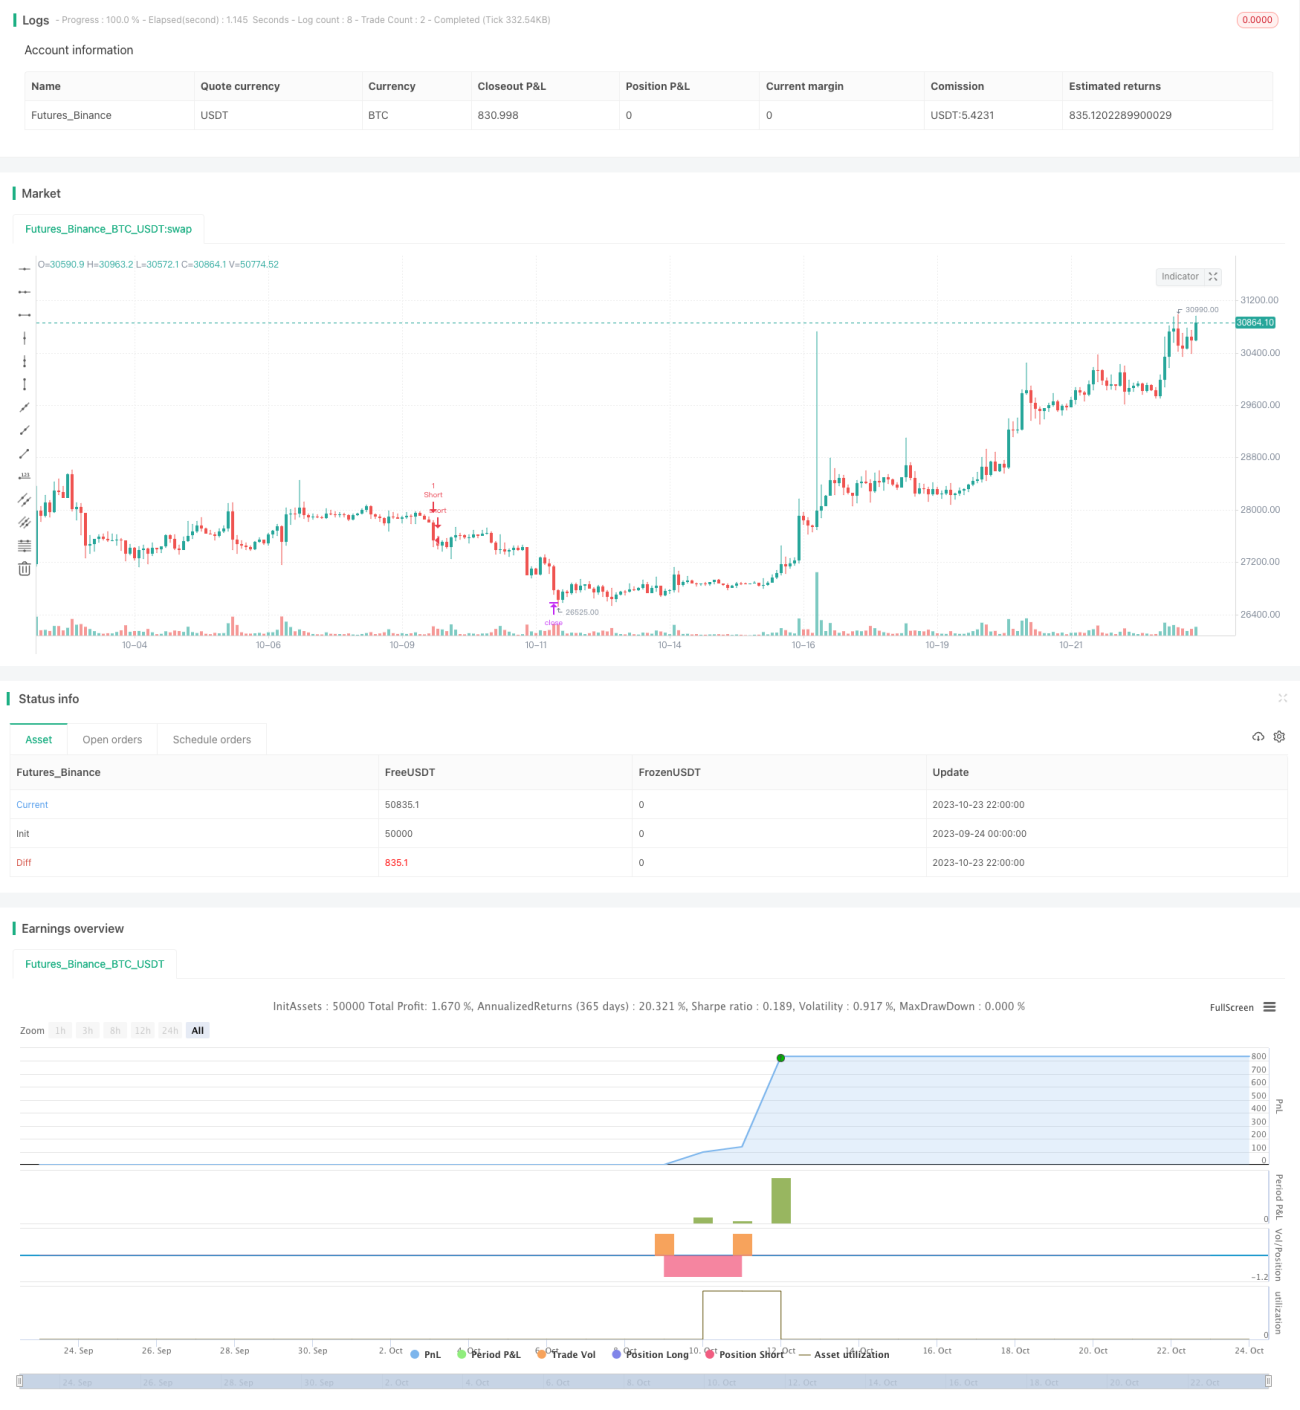
This strategy mainly combines Bollinger Bands and RSI indicators to judge trading signals, which is a typical frankenstein strategy. It integrates the advantages of different indicators by judging the trend direction through Bollinger Bands and detecting overbought and oversold situations through RSI to make entries and stop-loss exits.

Strategy Principle

  1. Use the middle band, upper band and lower band of Bollinger Bands to judge the current price trend. When the price breaks through the upper band, it is considered a bullish trend. When it breaks through the lower band, it is considered a bearish trend.

  2. The width of Bollinger Bands (difference between upper and lower bands) can reflect the current market volatility. When the width increases, it means volatility increases and RSI can better detect overbought and oversold situations.

  3. The RSI indicator judges overbought and oversold situations. Above 70 is the overbought zone and below 30 is the oversold zone. Avoid entering in overbought and oversold zones to obtain better risk-reward ratios.

  4. Specific trading signals: (1) Bullish signal: Price breaks through the upper band and RSI is not overbought (RSI less than 70) (2) Bearish signal: Price breaks through the lower band and RSI is not oversold (RSI greater than 30)

  5. Stop loss: For long trades, stop loss when RSI breaks below 70. For short trades, stop loss when RSI breaks above 30.

Advantage Analysis

The advantages of this strategy are:

  1. Integrating multiple indicators provides more comprehensive information and reliable signals.

  2. Using Bollinger Bands to determine the overall trend catches the big moves.

  3. The RSI indicator further avoids unnecessary risks by detecting local overbought and oversold levels.

  4. The stop loss mechanism is quite strict, which helps reduce losses.

Risk Analysis

This strategy also has the following risks:

  1. Both Bollinger Bands and RSI may fail, resulting in wrong trading signals.

  2. Although having a stop loss, improper stop loss points can still lead to major losses.

  3. Too frequent trading increases transaction costs and slippage.

  4. Improper optimization of parameters may lead to overfitting.

Optimization Directions

This strategy can be optimized in the following aspects:

  1. Test different parameter combinations to find the optimal parameters.

  2. Increase flexibility of stop loss methods, such as ADDR/ATR stop loss, trailing stop loss etc.

  3. Add position sizing strategies, such as fixed fraction, Martingale etc.

  4. Incorporate more indicators to filter signals, such as volume etc.

  5. Use machine learning for adaptive parameter optimization.

  6. Optimize entry timing, wait for confirmation signals before entering.

Conclusion

In summary, this is a typical frankenstein strategy combining multiple indicators. It integrates the advantages of Bollinger Bands and RSI to catch trends while avoiding overbought and oversold risks. With proper parameter optimization and stop loss management, good results can be achieved. But it also has some risks and needs further optimization to improve stability. Overall, the strategy idea is reasonable and has great room for improvement.


/*backtest
start: 2023-09-24 00:00:00
end: 2023-10-24 00:00:00
period: 2h
basePeriod: 15m
exchanges: [{"eid":"Futures_Binance","currency":"BTC_USDT"}]
*/

// This source code is subject to the terms of the Mozilla Public License 2.0 at https://mozilla.org/MPL/2.0/
// © evillalobos1123

//@version=5
strategy("Villa Dinamic Pivot Supertrend Strategy", overlay=true, calc_on_every_tick = true, default_qty_type = strategy.fixed)

//INPUTS

ema_b = input.bool(false, "Use Simple EMA Filter", group = "Strategy Inputs")
ema_b_ang = input.bool(true, "Use DEMA Angle Filter", group = "Strategy Inputs")
dema_b = input.bool(true, "Use DEMA Filter", group = "Strategy Inputs")
st_sig = input.bool(false, "Take Every Supertrend Signal" , group = "Strategy Inputs")
take_p = input.bool(true, "Stop Loss at Supertrend", group = "Strategy Inputs")
din_tp = input.bool(false, "2 Steps Take Profit", group = "Strategy Inputs")
move_sl = input.bool(true, "Move SL", group = "Strategy Inputs")
sl_atr = input.float(2.5, "Stop Loss ATR Multiplier", group = "Strategy Inputs")
tp_atr = input.float(4, "Take Profit ATR Multiplier", group = "Strategy Inputs")
din_tp_qty = input.int(50, "2 Steps TP qty%", group = "Strategy Inputs")
dema_a_filter = input.float(0, "DEMA Angle Threshold (+ & -)", group = "Strategy Inputs")
dema_a_look = input.int(1, "DEMA Angle Lookback", group = "Strategy Inputs")
dr_test = input.string("Backtest", "Testing", options = ["Backtest", "Forwardtest", "All"], group = "Strategy Inputs")

not_in_trade = strategy.position_size == 0

//Backtesting date range

start_year = input.int(2021, "Backtesting start year", group = "BT Date Range")
start_month = input.int(1, "Backtesting start month", group = "BT Date Range")
start_date = input.int(1, "Backtesting start day", group = "BT Date Range")
end_year = input.int(2021, "Backtesting end year", group = "BT Date Range")
end_month = input.int(12, "Backtesting end month", group = "BT Date Range")
end_date = input.int(31, "Backtesting end day", group = "BT Date Range")

bt_date_range = (time >= timestamp(syminfo.timezone, start_year,
         start_month, start_date, 0, 0)) and
     (time < timestamp(syminfo.timezone, end_year, end_month, end_date, 0, 0))
     

//Forward testing date range

start_year_f = input.int(2022, "Forwardtesting start year", group = "FT Date Range")
start_month_f = input.int(1, "Forwardtesting start month", group = "FT Date Range")
start_date_f = input.int(1, "Forwardtesting start day", group = "FT Date Range")
end_year_f = input.int(2022, "Forwardtesting end year", group = "FT Date Range")
end_month_f = input.int(03, "Forwardtesting end month", group = "FT Date Range")
end_date_f = input.int(26, "Forwardtesting end day", group = "FT Date Range")

ft_date_range = (time >= timestamp(syminfo.timezone, start_year_f,
         start_month_f, start_date_f, 0, 0)) and
     (time < timestamp(syminfo.timezone, end_year_f, end_month_f, end_date_f, 0, 0))


//date condition
date_range_cond = if dr_test == "Backtest"
    bt_date_range
else if dr_test == "Forwardtest"
    ft_date_range
else
    true
    

//INDICATORS

//PIVOT SUPERTREND
prd = input.int(2, "PVT ST Pivot Point Period", group = "Pivot Supertrend")
Factor=input.float(3, "PVT ST ATR Factor", group = "Pivot Supertrend")
Pd=input.int(9 ,  "PVT ST ATR Period", group = "Pivot Supertrend")

// get Pivot High/Low
float ph = ta.pivothigh(prd, prd)
float pl = ta.pivotlow(prd, prd)

// calculate the Center line using pivot points
var float center = na
float lastpp = ph ? ph : pl ? pl : na
if lastpp
    if na(center)
        center := lastpp
    else
        //weighted calculation
        center := (center * 2 + lastpp) / 3

// upper/lower bands calculation
Up = center - (Factor * ta.atr(Pd))
Dn = center + (Factor * ta.atr(Pd))

// get the trend
float TUp = na
float TDown = na
Trend = 0
TUp := close[1] > TUp[1] ? math.max(Up, TUp[1]) : Up
TDown := close[1] < TDown[1] ? math.min(Dn, TDown[1]) : Dn
Trend := close > TDown[1] ? 1: close < TUp[1]? -1: nz(Trend[1], 1)
Trailingsl = Trend == 1 ? TUp : TDown

// check and plot the signals
bsignal = Trend == 1 and Trend[1] == -1
ssignal = Trend == -1 and Trend[1] == 1

//get S/R levels using Pivot Points
float resistance = na
float support = na
support := pl ? pl : support[1]
resistance := ph ? ph : resistance[1]

//DEMA

dema_ln = input.int(200, "DEMA Len", group = 'D-EMAs')
dema_src = input.source(close, "D-EMAs Source", group = 'D-EMAs')
ema_fd = ta.ema(dema_src, dema_ln)
dema = (2*ema_fd)-(ta.ema(ema_fd,dema_ln))

//EMA

ema1_l = input.int(21, "EMA 1 Len", group = 'D-EMAs')
ema2_l = input.int(50, "EMA 2 Len", group = 'D-EMAs')
ema3_l = input.int(200, "EMA 3 Len", group = 'D-EMAs')

ema1 = ta.ema(dema_src, ema1_l)
ema2 = ta.ema(dema_src, ema2_l)
ema3 = ta.ema(dema_src, ema3_l)

//Supertrend
Periods = input.int(21, "ST ATR Period", group = "Normal Supertrend")
src_st = input.source(hl2, "ST Supertrend Source", group = "Normal Supertrend")
Multiplier = input.float(2.0 , "ST ATR Multiplier", group = "Normal Supertrend")
changeATR= true
atr2 = ta.sma(ta.tr, Periods)
atr3= changeATR ? ta.atr(Periods) : atr2
up=src_st-(Multiplier*atr3)
up1 = nz(up[1],up)
up := close[1] > up1 ? math.max(up,up1) : up
dn=src_st+(Multiplier*atr3)
dn1 = nz(dn[1], dn)
dn := close[1] < dn1 ? math.min(dn, dn1) : dn
trend = 1
trend := nz(trend[1], trend)
trend := trend == -1 and close > dn1 ? 1 : trend == 1 and close < up1 ? -1 : trend
buySignal = trend == 1 and trend[1] == -1
sellSignal = trend == -1 and trend[1] == 1

//ATR

atr = ta.atr(14)

///CONDITIONS

//BUY 
/// ema simple
ema_cond_b = if ema_b
    ema1 > ema2 and ema2 > ema3
else
    true

///ema angle

dema_angle_rad = math.atan((dema - dema[dema_a_look])/0.0001)
dema_angle = dema_angle_rad * (180/math.pi)

dema_ang_cond_b = if ema_b_ang
    if dema_angle >= dema_a_filter
        true
    else
        false
else
    true


///ema distance

dema_cond_b = if dema_b
    close > dema
else 
    true
    

//supertrends
///if pivot buy sig or (st buy sig and pivot. trend = 1)

pvt_cond_b = bsignal

st_cond_b = if st_sig
    buySignal and Trend == 1
else
    false

st_entry_cond = pvt_cond_b or st_cond_b

///stop loss tp

sl_b = if take_p
    if trend == 1
        up
    else
        close - (atr * sl_atr)
else
    close - (atr * sl_atr)

tp_b = if take_p
    if trend == 1
        close + ((close - up) * (tp_atr / sl_atr))
    else
        close + (atr * tp_atr)
else
    close + (atr * tp_atr)
    
//position size 
init_cap = strategy.equity
pos_size_b = math.round((init_cap * .01) / (close - sl_b))
ent_price = strategy.opentrades.entry_price(strategy.opentrades - 1)
var sl_b_n = 0.0
var tp_b_n = 0.0
longCondition = (ema_cond_b and dema_cond_b and dema_ang_cond_b and st_entry_cond and date_range_cond and not_in_trade)
if (longCondition)
    
    strategy.entry("Long", strategy.long, qty = pos_size_b)
    sl_b_n := sl_b
    tp_b_n := tp_b
    ent_price := strategy.opentrades.entry_price(strategy.opentrades - 1)

if (up[1] < ent_price and up >= ent_price and trend[0] == 1)
    if din_tp
        strategy.close("Long", qty_percent = din_tp_qty)
    if move_sl
        sl_b_n := ent_price

strategy.exit("Exit", "Long", stop =sl_b_n, limit = tp_b_n)   


//sell

///ema simple
ema_cond_s = if ema_b
    ema1 < ema2 and ema2 < ema3
else
    true

//ema distance
dema_cond_s = if dema_b
    close < dema
else 
    true

//dema angle
dema_ang_cond_s = if ema_b_ang
    if dema_angle <= (dema_a_filter * -1)
        true
    else
        false
else
    true

//supertrends
///if pivot buy sig or (st buy sig and pivot. trend = 1)

pvt_cond_s = ssignal

st_cond_s = if st_sig
    sellSignal and Trend == -1
else
    false

st_entry_cond_s = pvt_cond_s or st_cond_s

///stop loss tp


sl_s = if take_p
    if trend == -1
        dn
    else
        close + (atr * sl_atr)
else
    close + (atr * sl_atr)

tp_s = if take_p
    if trend == -1
        close - ((dn - close) * (tp_atr / sl_atr))
    else
        close - (atr * tp_atr)
else
    close - (atr * tp_atr)


shortCondition = (ema_cond_s and dema_cond_s and dema_ang_cond_s and st_entry_cond_s and not_in_trade)

pos_size_s = math.round((init_cap * .01) / (sl_s - close))
var sl_s_n = 0.0
var tp_s_n = 0.0
if (shortCondition)
    strategy.entry("Short", strategy.short, qty = pos_size_s)
    sl_s_n := sl_s
    tp_s_n := tp_s
    
if (dn[1] > ent_price and dn <= ent_price and trend[0] == -1)
    if din_tp
        strategy.close("Short", qty_percent = din_tp_qty)
    if move_sl
        sl_s_n := ent_price

strategy.exit("Exit", "Short", stop = sl_s_n, limit = tp_s_n)
    

More