Gradient Trailing Stop Loss Strategy

Overview
The Gradient Trailing Stop Loss strategy dynamically adjusts the stop loss line to balance risk control and profit taking. It uses the Average True Range (ATR) to calculate the stop loss line and effectively tracks price trends, protecting profits while reducing unnecessary stop outs. This strategy works well for stocks with strong trends and can generate steady returns.
Principles
The strategy uses the Average True Range (ATR) as the basis for dynamic stop loss. ATR effectively reflects the volatility of a stock. The strategy first takes the ATR period as input, typically 10 days. Then the ATR value is calculated. As the price rises, the stop loss line also moves up to trail the price. When the price drops, the stop loss line remains unchanged to lock in profits. Also, the strategy allows fine tuning the stop loss distance from the price using a "factor" parameter.
Specifically, the strategy calculates the current ATR, then multiplies it by the "factor" to get the stop loss distance. If the price is above the stop loss price, a long position is opened. If the price is below, a short position is opened. Thus, the stop loss line closely follows the price, achieving a gradient trailing effect.
Advantages
- Dynamic trailing stop loss adjusts stop distance based on market conditions
- ATR calculates stop distance based on market volatility
- Simple and easy to automate trading
- Customizable ATR period and stop loss factor for different assets
- Balances between stopping loss and profit taking
- Reduces unnecessary stop outs
Risks
- Choosing proper ATR parameters is crucial
- Stop loss too close may increase unnecessary stop outs
- Stop loss too far may fail to control risks
- Strategy itself cannot determine market trends
- Need to evaluate ATR period and factor settings
Enhancements
- Add filters like moving averages to reduce false signals
- Auto-optimize ATR period and stop loss factor via machine learning
- Incorporate profit taking strategy to lock in profits
- Combine with other indicators to verify buy/sell signals
- Research better ATR calculation or dynamic ATR period
- Explore other dynamic trailing stop algorithms
- Further optimize the stop loss effect
Conclusion
The Gradient Trailing Stop Loss strategy effectively balances risk and profit by dynamically adjusting the stop loss distance. With simple logic and high configurability, it is suitable for algorithmic trading. Proper parameter tuning and indicator combinations still rely on human expertise. Further optimizations can make this strategy even more profitable.
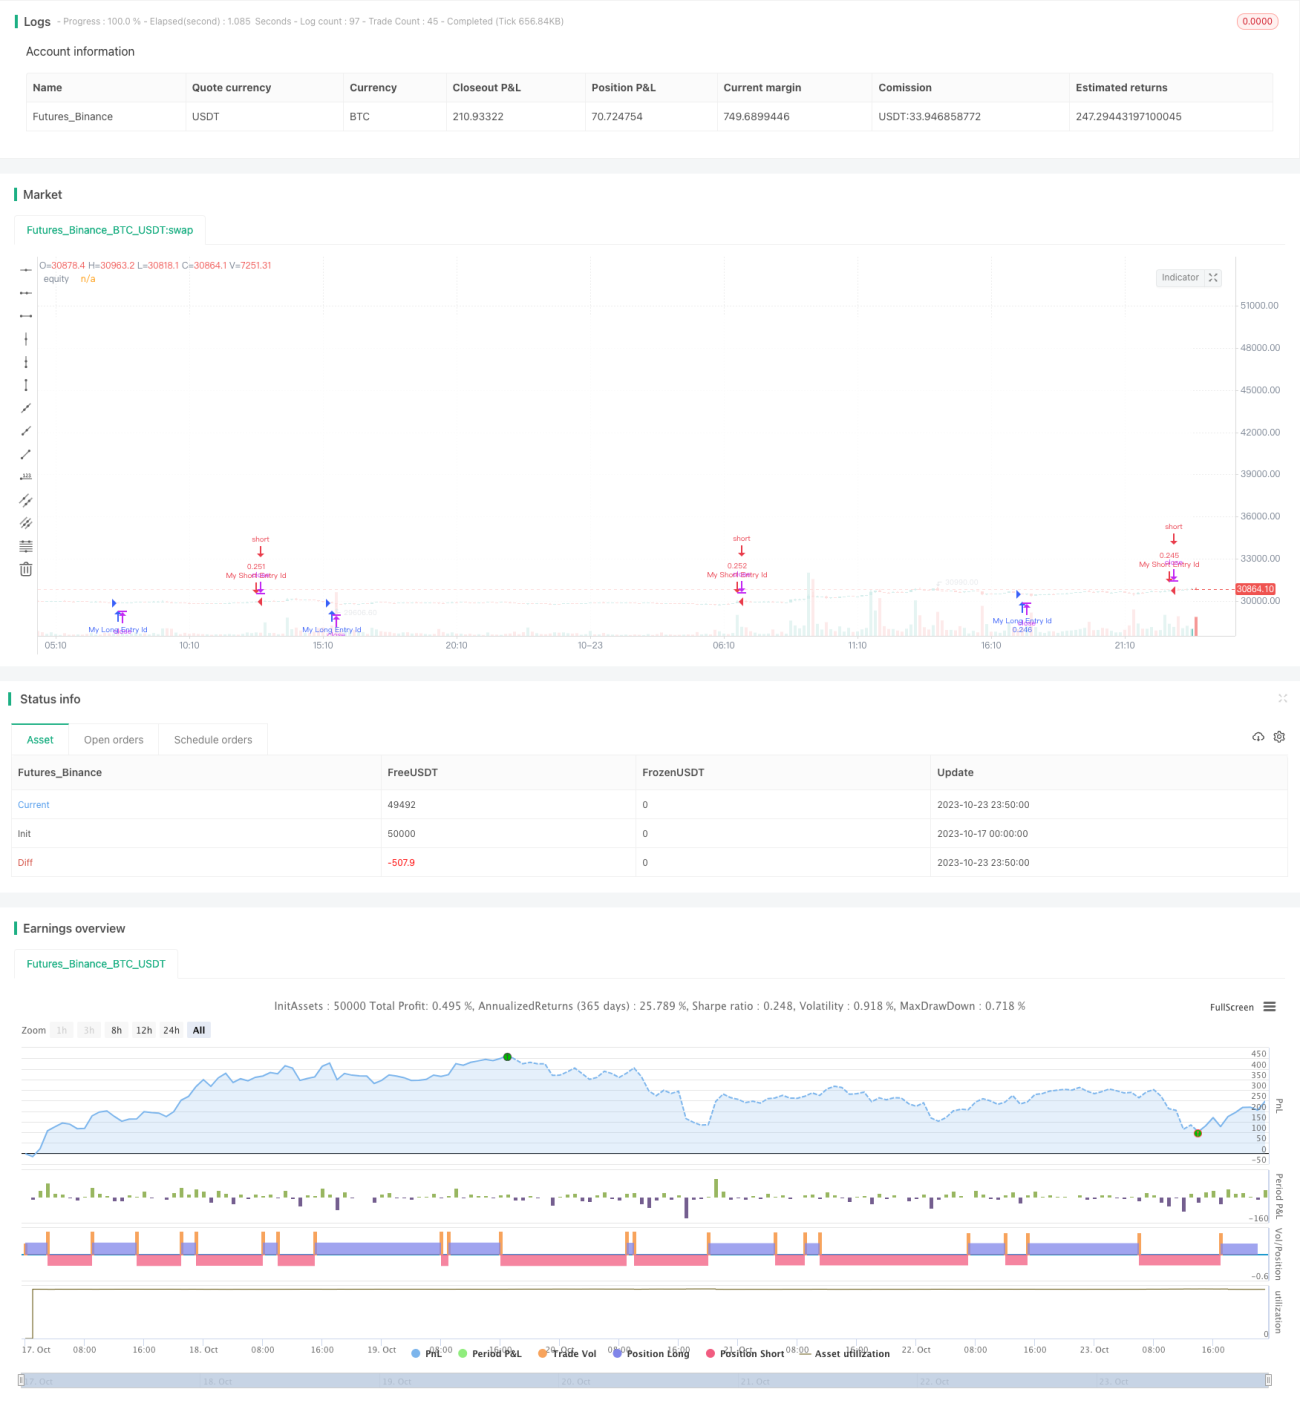
/*backtest
start: 2023-10-17 00:00:00
end: 2023-10-24 00:00:00
period: 10m
basePeriod: 1m
exchanges: [{"eid":"Futures_Binance","currency":"BTC_USDT"}]
*/

//@version=5
strategy("Supertrend Strategy, by Ho.J.", overlay=true, default_qty_type=strategy.percent_of_equity, default_qty_value=15)

// 백테스팅 시작일과 종료일 입력- 1