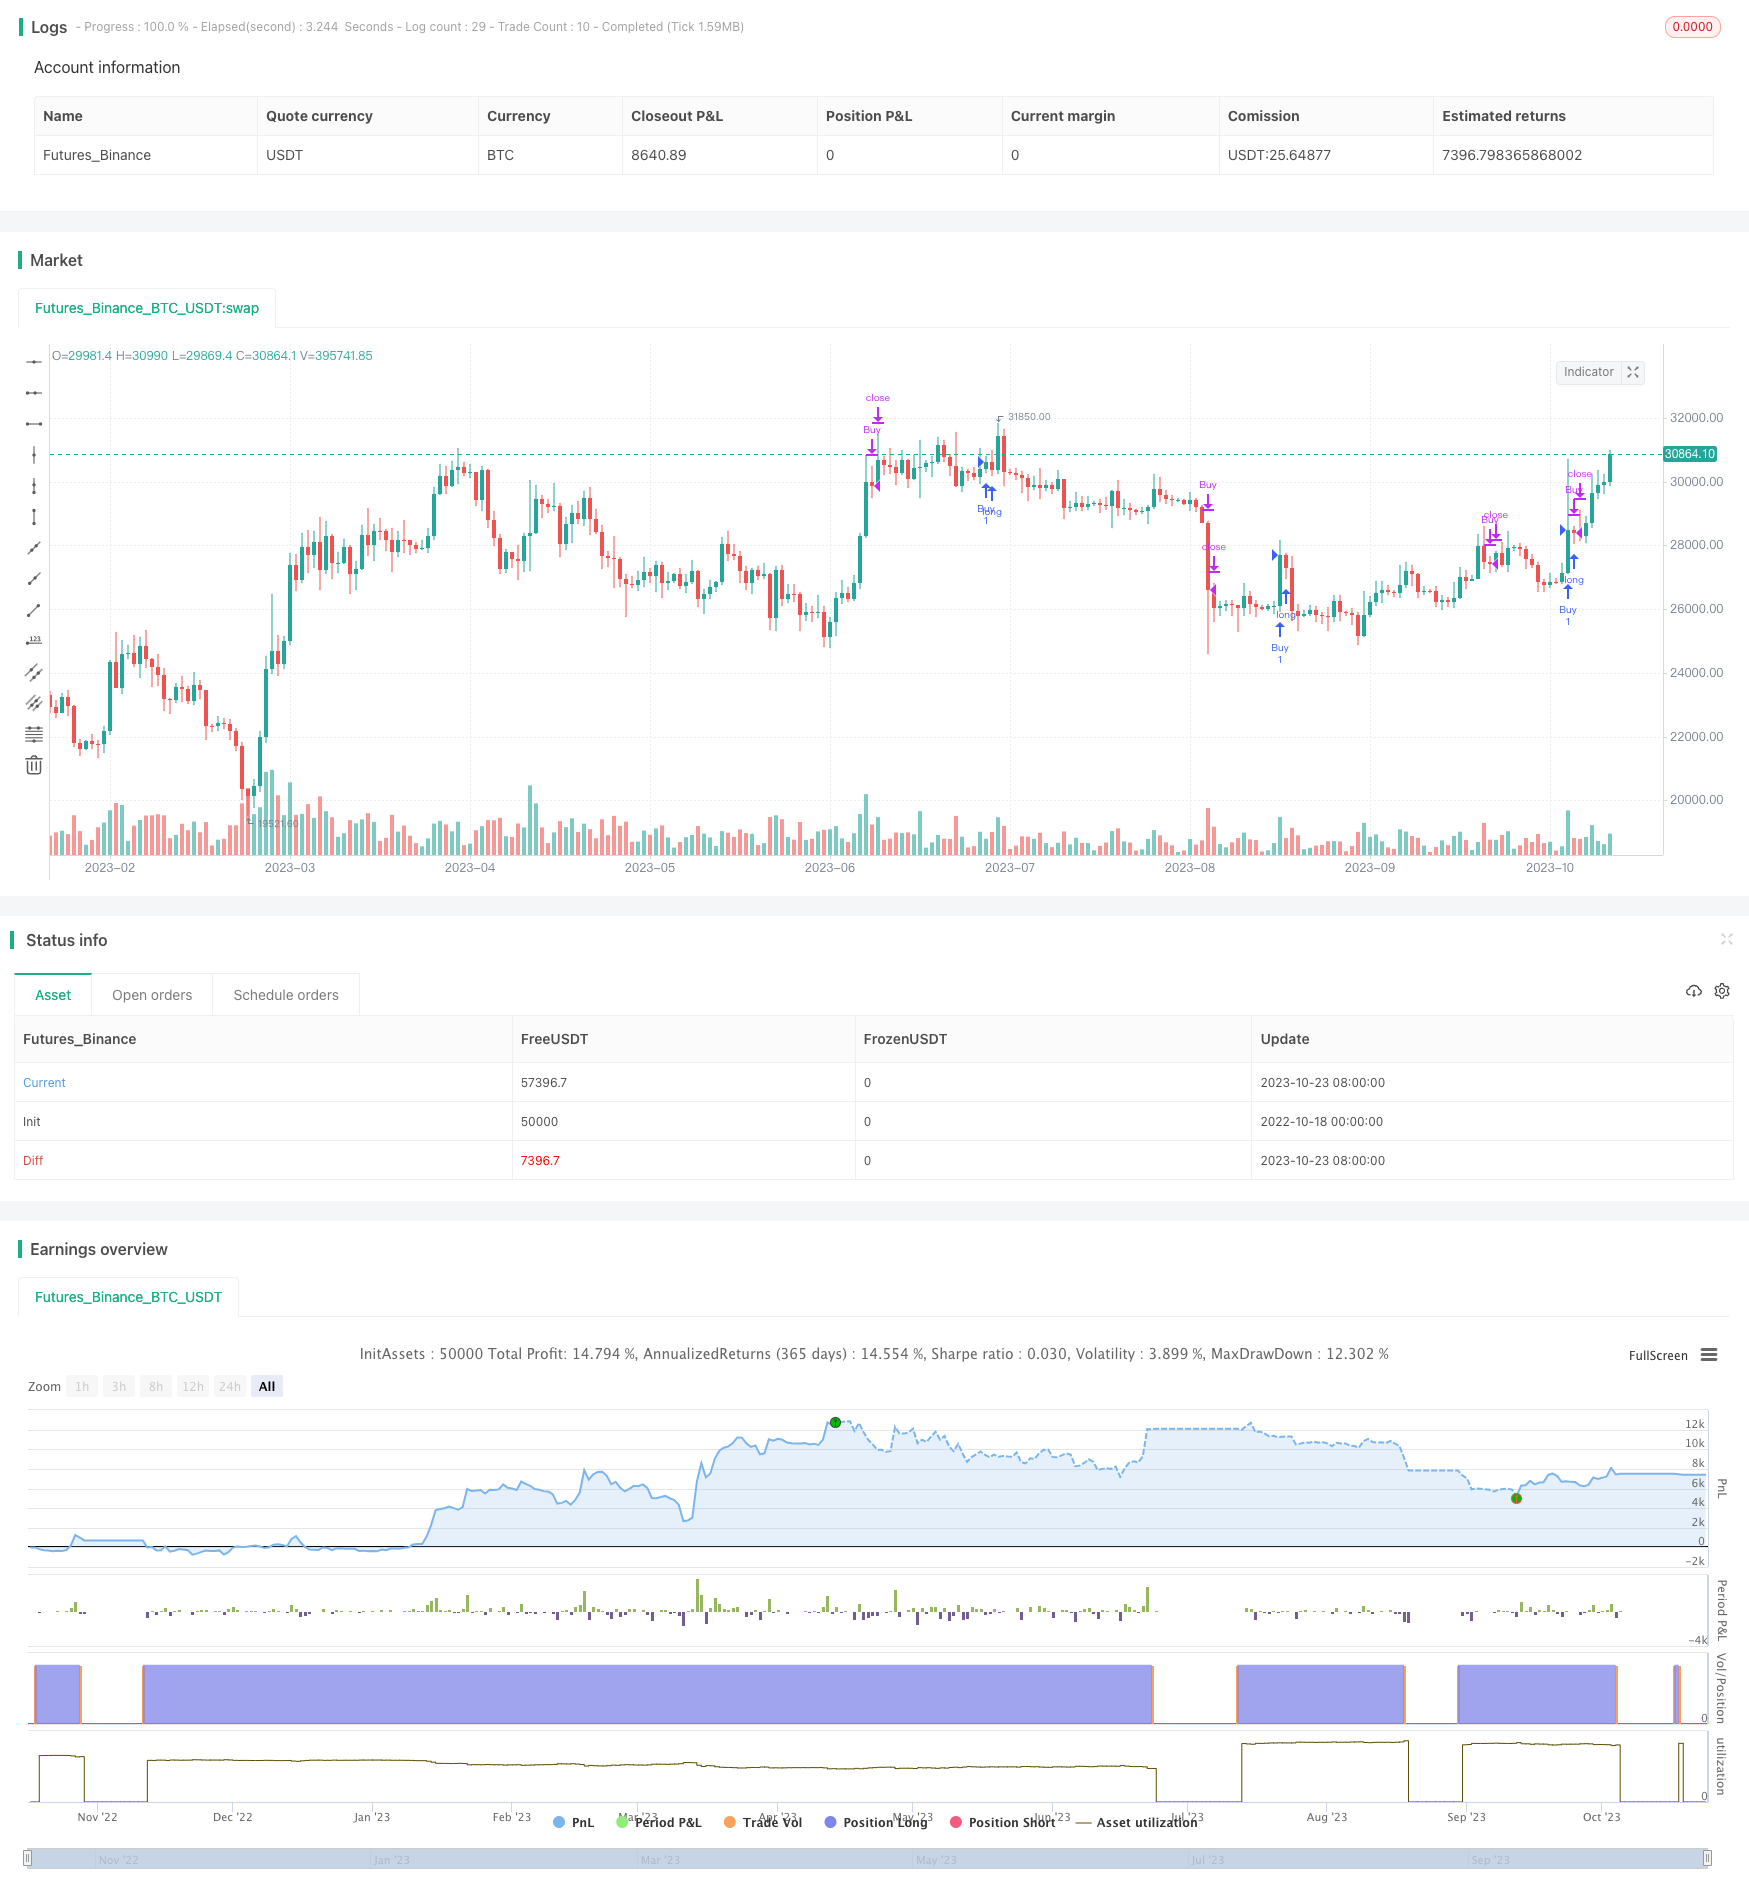
该策略基于布林带和双均线进行交易信号生成,同时结合趋势过滤,目标是追求高胜率和良好的盈亏比。
策略原理
使用布林带的上轨、中轨、下轨进行多空信号判定。当价格触碰上轨时看空,触碰下轨时看多。
使用长度为20的中短期均线和长度为60的长期均线进行趋势判断。当短期均线上穿长期均线时为看涨,下穿时为看跌。
根据布林带的宽度动态调整止损位置。当布林带宽度大于0.5%时,止损位置为下轨;当宽度小于0.5%时,止损位置缩小为下轨的一半区间。
入场条件:看涨时价格突破下轨作为做多信号,看跌时价格突破上轨作为做空信号。
出场条件:做多时触碰布林带上轨或短期均线时止盈;做空时触碰布林带下轨或短期均线时止盈。
止损条件:做多时价格跌破布林带下轨动态区间止损;做空时价格涨破布林带上轨动态区间止损。
策略优势
使用双均线进行趋势判断,能够有效过滤趋势不明或盘整市场的噪音。
布林带中轨作为支持阻力,上轨下轨作为动态止损位,可以控制风险。
根据布林带宽度调整止损幅度,降低止损被激活的概率,确保止损位置合理。
追踪趋势方向交易,胜率较高。
策略风险
双均线生成假突破的概率较大,可能错过趋势转折点。可以适当缩短均线周期。
布林带在震荡趋势中容易被套住。可以通过降低交易频次来规避。
止损位置靠近支持阻力时容易被击穿。可以适当放宽止损范围。
无法有效捕捉短线回调的机会。可以适当缩短持仓时间。
策略优化方向
优化均线周期参数,找到策略适合的市场环境。
优化布林带的倍数参数,平衡止损被击穿的概率。
添加其他指标进行多Factor验证,提高信号质量。
结合交易量能量来判断趋势,避免出现背离。
资金管理优化,例如固定份额、固定止损等,控制单笔损失。
价格 shock 处理,例如大幅跳空缺口的情况。
总结
本策略整体较为稳健,以双均线判断趋势方向,布林带提供支撑阻力位并设置动态止损。但也存在一定的局限性,如误判趋势、止损过近等问题。后续可以从均线系统、止损策略、资金管理等多个方面进行优化,使策略参数更具鲁棒性,在各种市场环境中都能保持稳定的表现。总体来说,本策略以其较高的胜率、良好的盈亏比而脱颖而出,是一种非常适合新手使用的简单有效的策略思路。
/*backtest
start: 2022-10-18 00:00:00
end: 2023-10-24 00:00:00
period: 1d
basePeriod: 1h
exchanges: [{"eid":"Futures_Binance","currency":"BTC_USDT"}]
*/

//@version=2
strategy(title="yuthavithi BB Scalper 2 strategy", overlay=true)

len = input(20, minval=1, title="Length")
multiplier = input(4, minval=1, title="multiplier")
trendTimeFrame = input(60, minval=1, title="Trend Time Frame")
useTrendFilter = input(true, type=bool, title = "Use Trend Filter")

src = input(close, title="Source")
out = sma(src, len)
//plot(out, title="SMA", color=blue)

stdOut = stdev(close, len)
bbUpper = out + stdOut * multiplier
bbLower = out - stdOut * multiplier
bbUpper2 = out + stdOut * (multiplier / 2)
bbLower2 = out - stdOut * (multiplier / 2)
bbUpperX2 = out + stdOut * multiplier * 2
bbLowerX2 = out - stdOut * multiplier * 2
bbWidth = (bbUpper - bbLower) / out


closeLongTerm = request.security(syminfo.tickerid, tostring(trendTimeFrame), close)
smaLongTerm = request.security(syminfo.tickerid, tostring(trendTimeFrame), sma(close,20))

//plot(smaLongTerm, color=red)

trendUp = useTrendFilter ? (closeLongTerm > smaLongTerm) : true
trendDown = useTrendFilter? (closeLongTerm < smaLongTerm) : true

bearish = ((cross(close,bbUpper2) == 1) or (cross(close,out) == 1)) and (close[1] > close) and trendDown
bullish = ((cross(close,bbLower2) == 1) or (cross(close,out) == 1)) and (close[1] < close) and trendUp


closeBuy = (high[1] > bbUpper[1]) and (close < bbUpper) and (close < open) and trendUp
closeSell = (((low[1] < bbLower[1]) and (close > bbLower)) or ((low[2] < bbLower[2]) and (close[1] > bbLower[1]))) and (close > open) and trendDown


cutLossBuy = iff(bbWidth > 0.005, (low < bbLower) and (low[1] > bbLower[1]) and trendUp, (low < bbLowerX2) and (low[1] > bbLowerX2[1]) and trendUp)
cutLossSell = iff(bbWidth > 0.005, (high > bbUpper) and (high[1] < bbUpper[1]) and trendDown, (high > bbUpperX2) and (high[1] < bbUpperX2[1]) and trendDown)


if (bullish)
    strategy.entry("Buy", strategy.long, comment="Buy")

if (bearish)
    strategy.entry("Sell", strategy.short, comment="Sell")


strategy.close("Buy", closeBuy or cutLossBuy)

strategy.close("Sell", closeSell or cutLossSell)