ATR Adjustable Trailing Stop Loss Strategy

This strategy uses the ATR indicator to calculate a dynamic stop loss line for risk control.
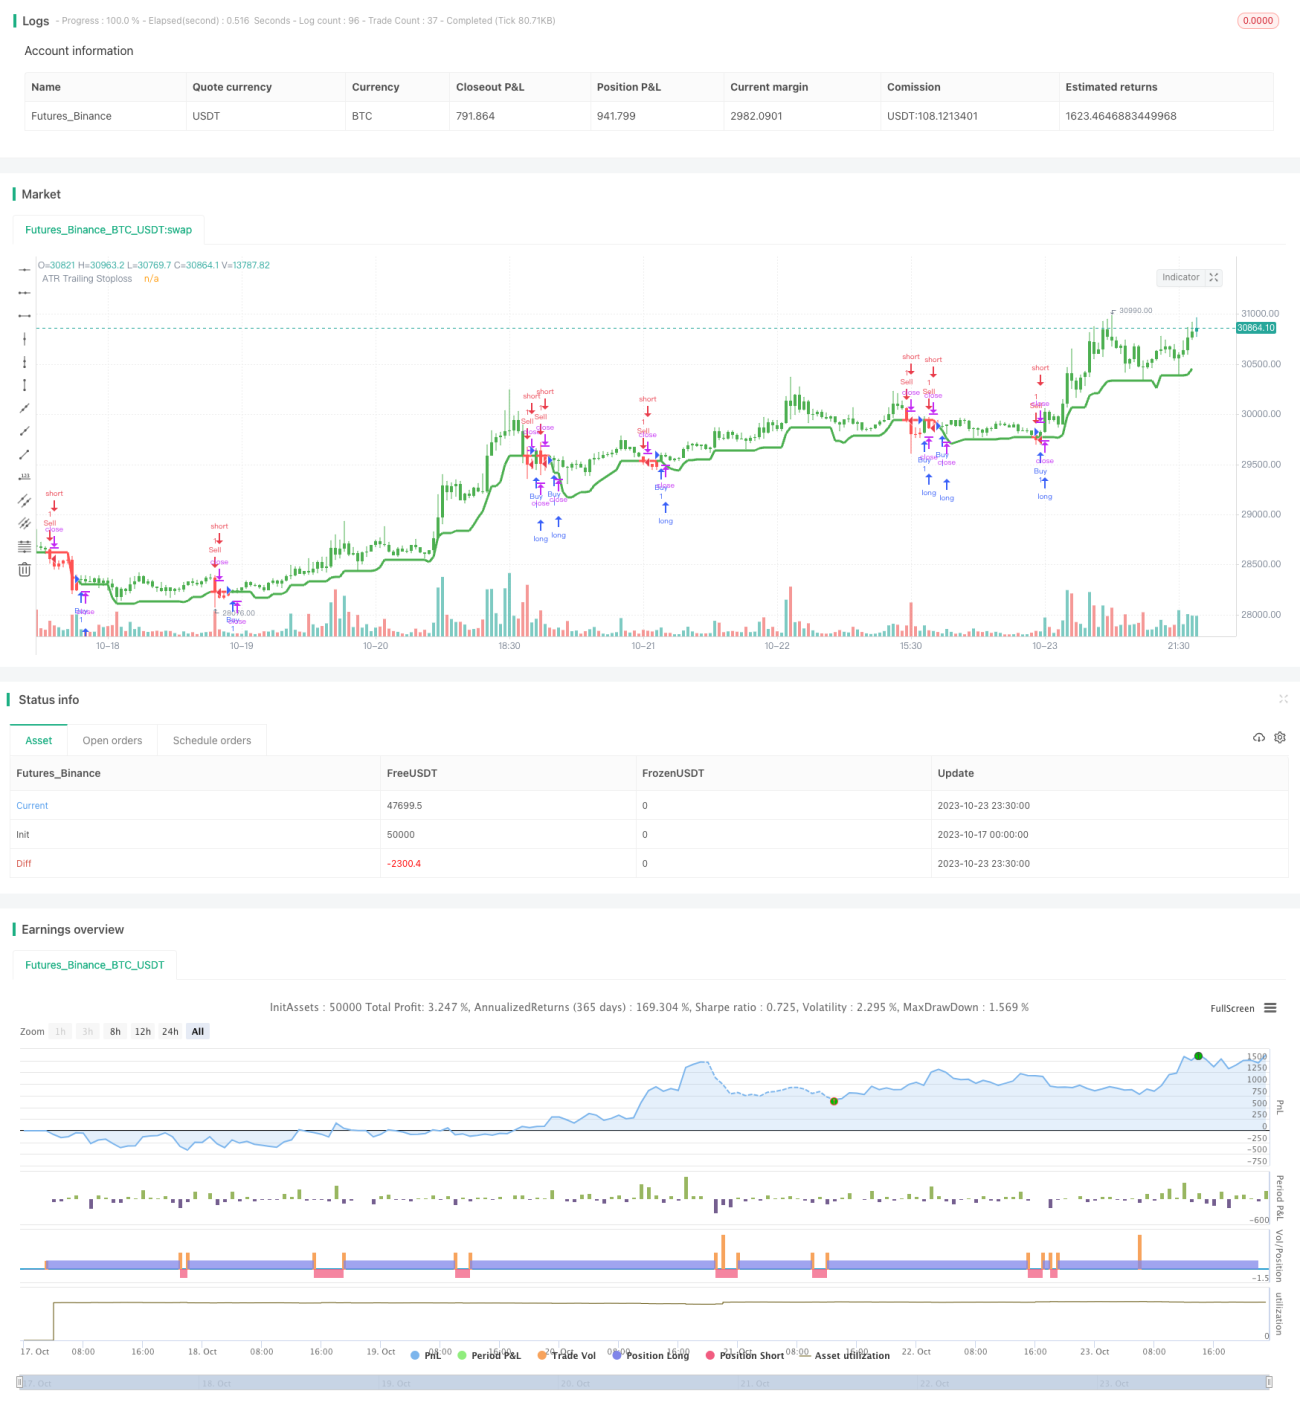
Overview
The strategy uses the ATR indicator to calculate a dynamic stop loss line. When prices rise, the stop loss line will move up with prices to lock in profits. When prices fall, the stop loss line remains unchanged to avoid being stopped out. The ATR indicator can measure market volatility and risk. Multiplying it by a coefficient generates the stop loss line, thus controlling the risk exposure per trade.
Principles
The strategy uses the ATR indicator and Highest function to calculate the dynamic stop loss line. The specific formula is:
pine
TS=highest(high-Mult*atr(Atr),Hhv)
Where Atr is the ATR period parameter, Hhv is the lookback period parameter of the Highest function, and Mult is the ATR coefficient.
The logic is to first calculate the ATR value, then multiply it by the Mult coefficient to get the range of the stop loss buffer zone. Then use the Highest function to find the highest high in the past Hhv periods, and subtract the stop loss buffer zone to obtain the dynamic stop loss line TS.
When prices rise, the highest high will be constantly updated, driving the stop loss line to move up and locking in profits. When prices fall, the stop loss line will maintain the previous high point to avoid being stopped out.
Advantages
- Dynamic stop loss for timely profit taking
The stop loss line adjusts dynamically to track the highest point after price rises, allowing timely profit taking. This is superior to fixed stop loss.
- Avoid unnecessary stop loss
Fixed stop loss lines can easily be triggered by normal pullbacks or overtight stops. This strategy keeps the stop loss unchanged during price declines to avoid unnecessary stops.
- Adjustable stop loss range
By tuning the ATR period and multiplier parameters, the sensitivity of the stop loss adjustment can be controlled for different degrees of stops.
- Controllable risk
The ATR dynamically calculates the stop loss range, allowing reasonable stop loss ranges according to market volatility for risk control per trade.
Risks
- Stop loss too aggressive during high volatility
When volatility spikes, ATR rises quickly and drives the stop loss line up rapidly, increasing the chance of unnecessary stops. The ATR period can be adjusted to make the line less sensitive.
- Difficult to adapt to sharp reversals
The strategy struggles to adapt to sharp reversals. The stop loss line may lag too much and needs timely position reduction.
- Difficult optimization
Optimizing the ATR period, Highest period and multiplier parameters together can be challenging. Stepped parameter sweep testing is recommended.
Optimization
- Optimize ATR Period
Increase ATR period to reduce overly frequent stop line adjustment, but at the cost of larger loss per stop.
- Optimize Highest Period
Increase Highest period to make the line more stable, but balance tracking speed.
- Test different ATR coefficients
Choose proper ATR multipliers according to instrument characteristics. Larger multipliers widen stops, smaller ones decrease loss per stop.
- Add trend filter
Adding a trend filter reduces the chance of stops being triggered by reversals.
Summary
The strategy has the advantage of dynamic stops and controllable risks. It fits trending markets but watch out for volatility spikes and difficult parameter optimization. With proper settings, optimization and additional techniques, it can be applied for live trading.
- 1