RSI Divergence Trading Strategy

Author: ChaoZhang, Date: 2023-10-25 16:47:14
Tags:

img

Overview

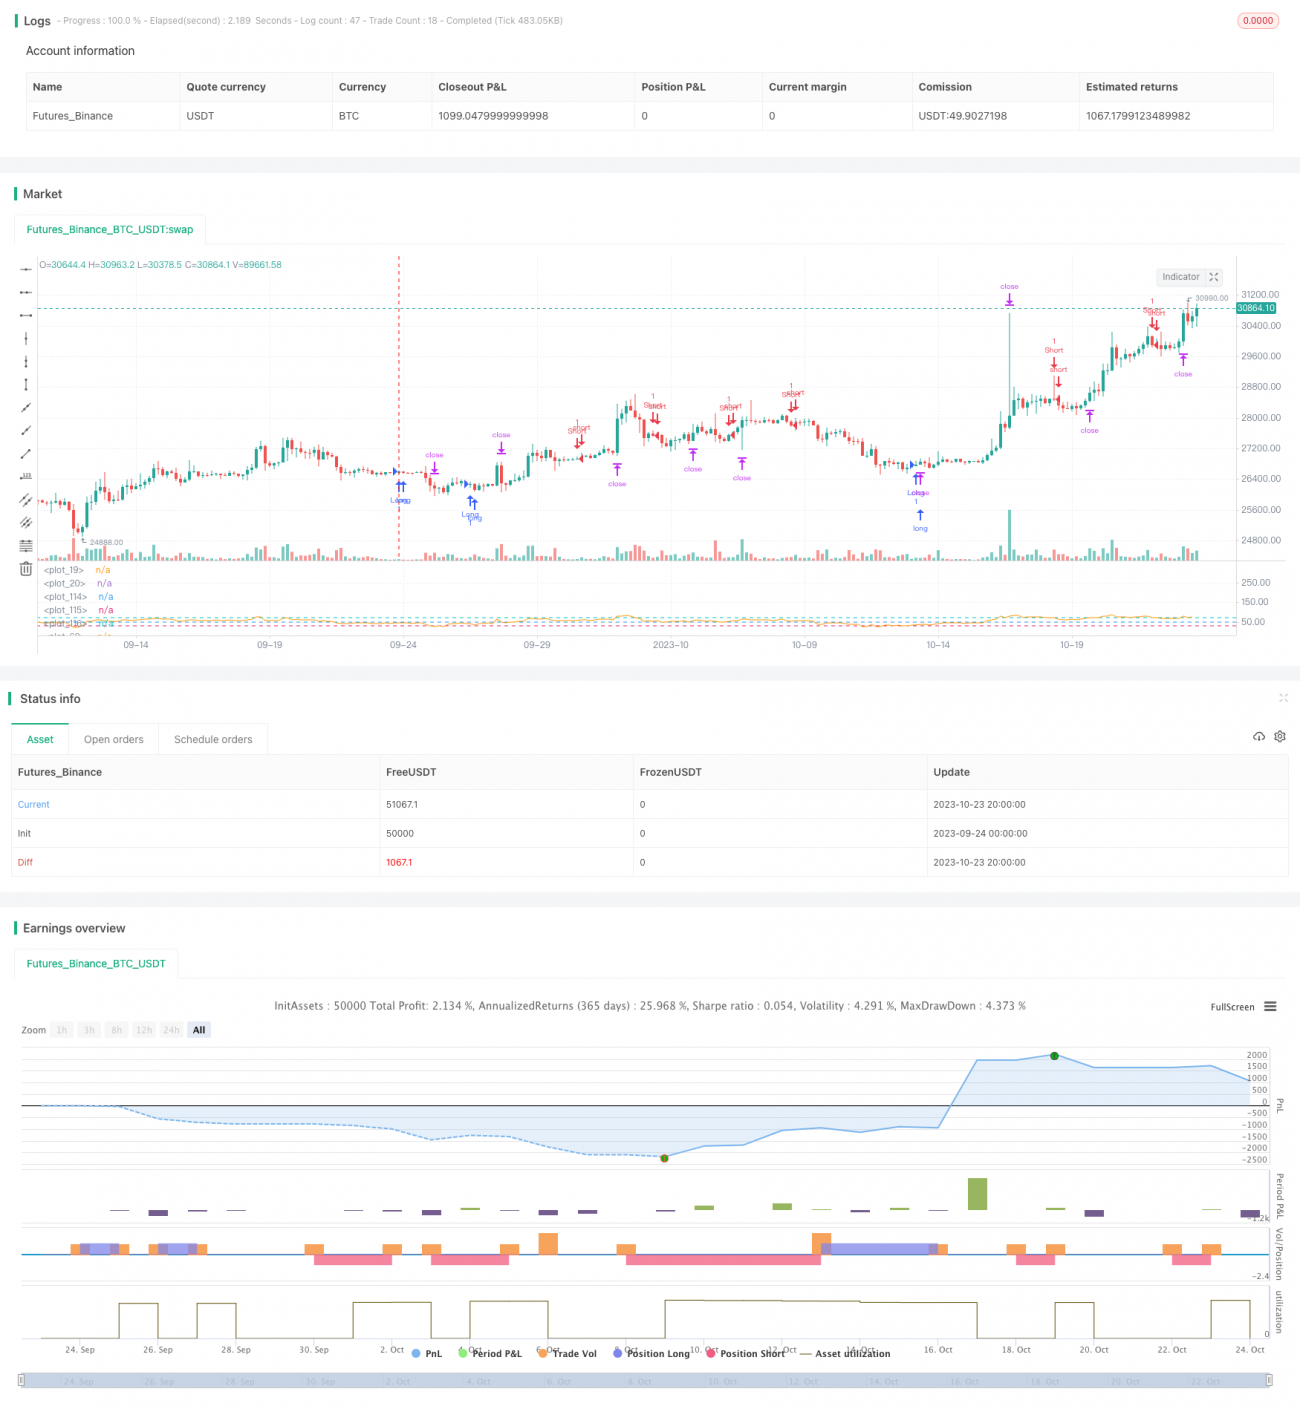
The RSI Divergence trading strategy generates buy and sell signals by identifying divergences between the RSI indicator and price movement. The strategy also incorporates stop loss, take profit and trailing stop loss to effectively manage risks.

Principle

This strategy mainly uses divergences in the RSI indicator to identify trading opportunities. Specifically, the strategy first calculates the RSI values over a certain period, then plots the trendlines for both the RSI indicator and price. When the RSI line diverges from the price line, i.e. RSI rises while price falls, or RSI falls while price rises, the strategy takes it as a sign of impending trend reversal and generates trading signals.

If the strategy detects the RSI line bottoming while the price line topping, a buy signal is generated. If the RSI line tops while the price line bottoms, a sell signal is generated. Once a trading signal occurs, the strategy can trade according to the RSI value size.

In addition, the strategy has stop loss, take profit and trailing stop loss features. Stop loss controls downside risks, take profit locks in profits, and trailing stop allows profits to run. These settings effectively manage the risks for each trade.

Advantages

The RSI divergence trading strategy has the following advantages:

  1. Capturing RSI divergences can early detect trend reversals.

  2. RSI is widely used and available in most trading platforms. The strategy has high applicability.

  3. RSI parameters are flexible and can be adjusted for different market conditions.

  4. The stop loss, take profit and trailing stop loss controls risk effectively.

  5. The strategy has a moderate signal frequency, avoiding over-trading.

  6. The logic is simple and easy to program for automation.

Risks

The strategy also has some risks:

  1. RSI divergences are not completely reliable and may generate false signals. Other filters are needed.

  2. Divergences may fail in strong trending markets, which should be avoided.

  3. Improper RSI parameters can affect performance. Too short periods increase frequency and risk.

  4. Stop loss set too tight cuts profits short; too loose fails to limit risk. Fine tuning is needed.

  5. Trailing stop may stop out prematurely during volatile markets. Reasonable trailing width is required considering volatility.

The risks can be mitigated through:

  1. Adding other indicators like MACD, Bollinger Bands to filter signals and reduce false signals.

  2. Using the strategy only during range-bound sideways markets, avoiding strong trends.

  3. Optimizing RSI parameters, selecting optimal lookback periods. Testing parameters for different markets.

  4. Setting reasonable stop loss and take profit levels based on historical backtesting.

  5. Adjusting trailing stop distance based on market volatility and risk appetite.

Optimization

The strategy can be improved in the following aspects:

  1. Incorporate other indicators to filter signals and improve reliability.

  2. Utilize machine learning to auto optimize RSI parameters.

  3. Design dynamic stop loss algorithms according to market regimes. Wider stops for ranging, tighter stops for trending markets.

  4. Build dynamic position sizing model based on volatility to adjust position sizes.

  5. Introduce volatility in trailing stop to set trail distance based on price swings.

  6. Deploy strategy to other markets like forex and crypto currencies.

  7. Develop a quantitative trading system for automation.

Conclusion

The RSI divergence trading strategy generates signals by identifying divergences between RSI and price. The logic is simple and easy to automate. The stop loss, take profit and trailing stop effectively controls risks. However, the strategy has limitations in accuracy and trending markets. Improvements can be made through optimizing parameters, adding filters and dynamic stops. As a technical strategy, it can serve as a complement during range-bound markets when systemized.


/*backtest
start: 2023-09-24 00:00:00
end: 2023-10-24 00:00:00
period: 4h
basePeriod: 15m
exchanges: [{"eid":"Futures_Binance","currency":"BTC_USDT"}]
*/

// This source code is subject to the terms of the Mozilla Public License 2.0 at https://mozilla.org/MPL/2.0/
// © faytterro

//@version=5
// strategy("RSI Divergence Strategy", overlay=true, scale = scale.none)
rsilen=input.int(14, title="rsi length")
rsisrc=input(close, title="source")
x=ta.rsi(rsisrc,rsilen)
len=input.int(14, title="RSI Divergence length", maxval=500)
tpb = input.float(25, title="take profit", group = "buy", step = 0.5)
sb = input.float(5, title="stop", group = "buy", step = 0.5)
tsb = input.float(0.25, title="trailing stop", group = "buy", step = 0.5)
tps = input.float(25, title="take profit", group = "sell", step = 0.5)
ss =input.float(5, title="stop", group = "sell", step = 0.5)
tss = input.float(0.25, title="trailing stop", group = "sell", step = 0.5)
src=close
extrapolation=0
zoom=input.int(0, title="zoom", maxval=27, minval=-27)
hline(300-zoom*10, color=color.rgb(54, 58, 69, 100))
hline(10, color=color.rgb(54, 58, 69, 100))
// for ax+b
xo=0.0
yo=0.0
xyo=0.0
xxo=0.0
for i=0 to len-1
    xo:= xo + i/(len)
    yo:= yo + x[len-1-i]/(len)
    xyo:= xyo + i*x[len-1-i]/(len)
    xxo:= xxo + i*i/(len)
dnm=ta.lowest(low,200)
dizi=array.new_float(len*2+1+extrapolation)
// linedizi=array.new_line()
a=(xo*yo-xyo)/(xo*xo-xxo)
b=yo-a*xo
for i=0 to len-1+extrapolation
    array.set(dizi,i,a*i+b)
//// for src
// for ax+b
xo2=0.0
yo2=0.0
xyo2=0.0
xxo2=0.0
for i=0 to len-1
    xo2:= xo2 + i/(len)
    yo2:= yo2 + src[len-1-i]/(len)
    xyo2:= xyo2 + i*src[len-1-i]/(len)
    xxo2:= xxo2 + i*i/(len)

dizi2=array.new_float(len*2+1+extrapolation)
// linedizi2=array.new_line()
a2=(xo2*yo2-xyo2)/(xo2*xo2-xxo2)
b2=yo2-a*xo2
for i=0 to len-1+extrapolation
    array.set(dizi2,i,a2*i+b2)
ttk=((array.get(dizi,0)<array.get(dizi,1)) and (array.get(dizi2,0)>array.get(dizi2,1)))? 1 : 
 ((array.get(dizi,0)>array.get(dizi,1)) and (array.get(dizi2,0)<array.get(dizi2,1)))? -1 : 0
cg=((array.get(dizi,0)<array.get(dizi,1)) and (array.get(dizi2,0)>array.get(dizi2,1)))// and ta.highest(ttk[1],len/2)<1)
cr=((array.get(dizi,0)>array.get(dizi,1)) and (array.get(dizi2,0)<array.get(dizi2,1)))// and ta.lowest(ttk[1],len/2)>-1)
bgcolor(color=(cg and ta.highest(ttk[1],len/2)<1)? color.rgb(76, 175, 79, 50) : 
 (cr and ta.lowest(ttk[1],len/2)>-1)? color.rgb(255, 82, 82, 50) : na, offset=0, display=display.none)
plot(x)

// for ax+b
xo3=0.0
yo3=0.0
xyo3=0.0
xxo3=0.0
for i=0 to len-1
    xo3:= xo3 + i/(len)
    yo3:= yo3 + x[len-1-i+(ta.barssince(cg))]/(len)
    xyo3:= xyo3 + i*x[len-1-i+(ta.barssince(cg))]/(len)
    xxo3:= xxo3 + i*i/(len)

dizi3=array.new_float(len*2+1+extrapolation)
// linedizi3=array.new_line()
a3=(xo3*yo3-xyo3)/(xo3*xo3-xxo3)
b3=yo3-a3*xo3
for i=0 to len-1+extrapolation
    array.set(dizi3,i,a3*i+b3)

// for ax+b
xo4=0.0
yo4=0.0
xyo4=0.0
xxo4=0.0
for i=0 to len-1
    xo4:= xo4 + i/(len)
    yo4:= yo4 + x[len-1-i+(ta.barssince(cr))]/(len)
    xyo4:= xyo4 + i*x[len-1-i+(ta.barssince(cr))]/(len)
    xxo4:= xxo4 + i*i/(len)

dizi4=array.new_float(len*2+1+extrapolation)
// linedizi4=array.new_line()
a4=(xo4*yo4-xyo4)/(xo4*xo4-xxo4)
b4=yo4-a4*xo4
for i=0 to len-1+extrapolation
    array.set(dizi4,i,a4*i+b4)

// line=line.new((last_bar_index-ta.barssince(cg)-len),
//  array.get(dizi3,0), 
//  last_bar_index-ta.barssince(cg),
//  array.get(dizi3,len-1), color=color.rgb(0,255,0), width=2)
// line2=line.new((last_bar_index-ta.barssince(cr)-len),
//  array.get(dizi4,0), 
//  last_bar_index-ta.barssince(cr),
//  array.get(dizi4,len-1), color=color.rgb(255, 0, 0, 0), width=2)
// line.delete(line[1])
// line.delete(line2[1])

alert=((array.get(dizi,0)<array.get(dizi,1)) and (array.get(dizi2,0)>array.get(dizi2,1)) and ta.highest(ttk[1],len/2)<1)
 or ((array.get(dizi,0)>array.get(dizi,1)) and (array.get(dizi2,0)<array.get(dizi2,1)) and ta.lowest(ttk[1],len/2)>-1)
alertcondition(alert)
hline(50)
rs=hline(30)
rss=hline(70)
fill(rs, rss, color=color.rgb(126, 87, 194, 90), title="RSI Background Fill")

longCondition = cg and ta.highest(ttk[1],len/2)<1 
if (longCondition)
    strategy.entry("Long", strategy.long)
    strategy.exit("exit long", "Long", limit = close*(100+tpb)/100 , stop =close*(100-sb)/100 , trail_price = close , trail_offset = close*tsb)

shortCondition = cr and ta.lowest(ttk[1],len/2)>-1 
if (shortCondition)
    strategy.entry("Short", strategy.short)
    strategy.exit("exit short", "Short", limit = close*(100-tps)/100, stop = close*(100+ss)/100, trail_price = close , trail_offset = close*tss)


More