Quantitative Trading Strategy Based on Multiple Indicators

Overview
This strategy combines multiple technical indicators to make long and short trading decisions. It mainly uses Bollinger Bands, RSI, ADX and other indicators, together with moving averages to determine trend direction.
Strategy Logic
The strategy mainly uses Bollinger Bands to judge price volatility. Narrowing bands represents decreasing volatility which may lead to a breakout. RSI is used to identify overbought and oversold conditions. RSI above 70 is overbought while below 30 is oversold. When bands narrow and RSI approaches its limits, reverse trading is considered.
In addition, ADX is used to assess trend strength. High ADX represents a strong trend, favoring trend trading. Low ADX represents no clear trend, considering mean reversion. Finally, moving averages define long-term trend direction. Uptrend favors long while downtrend favors short.
Specifically, when bands squeeze, RSI nears its limits, and price breaks below lower band, a bounce is expected, go long. When bands squeeze, RSI nears its limits, and price breaks above upper band, a decline is expected, go short. Also, with high ADX, add longs in uptrend. With low ADX, add shorts in downtrend. Combining indicators improves system robustness.
Advantage Analysis
The multi-indicator strategy has these advantages:
-
Combining indicators improves accuracy and robustness. Single indicator is prone to false signals while multiple indicators verify signals and avoid bad trades.
-
Considers both trend and range trading, adaptable to different market conditions. Trend trading targets big moves. Range trading aims for small profits.
-
Longs and shorts lower directional risks and avoid extreme moves.
-
Stop loss and take profit lock in profits and limit losses when trades go wrong.
-
Parameter optimization continuously improves strategy by adapting to changing markets.
Risk Analysis
The strategy also has some risks:
-
More indicators increase complexity. Improper settings may degrade performance. Extensive testing and optimization are needed.
-
Overreliance on technicals while ignoring fundamentals may cause inaccurate signals. Indicator false signals should be treated with caution.
-
Markets may have already moved when signals emerge, posing chasing risk. Allowing pullbacks is prudent.
-
Dual direction trading increases frequency, raising costs and pressure. Position sizing needs control.
-
Curve fitting risks exist. Robustness should be tested across diverse markets.
Risks can be managed through strict stop loss, prudent position sizing, reasonable leverage etc. Overall, the strategy has strong practical value.
Enhancement Opportunities
Some ways to optimize the strategy:
-
Test different parameter sets to find optimum values using stepwise, random or genetic algorithms.
-
Add more indicators like KDJ, Williams to build a robust indicator ensemble.
-
Optimize position sizing models to dynamically manage risk.
-
Incorporate machine learning models to predict price trends and movements.
-
Test across different products, timeframes and markets to improve adaptiveness.
-
Refine entry and exit timing to capture trends early and exit before reversals.
-
Employ profit taking, trailing stops to lock in profits and limit losses.
-
Add fundamental factors and market structure analysis to filter technical signals.
Summary
This strategy automates trading by interpreting multiple indicators. It benefits from indicator cross-validation, dual direction trading, stop loss/take profit etc. Overfitting and false signals require caution. Continuous optimization and testing can transform it into a robust, practical system, representing the future of quant trading strategies.
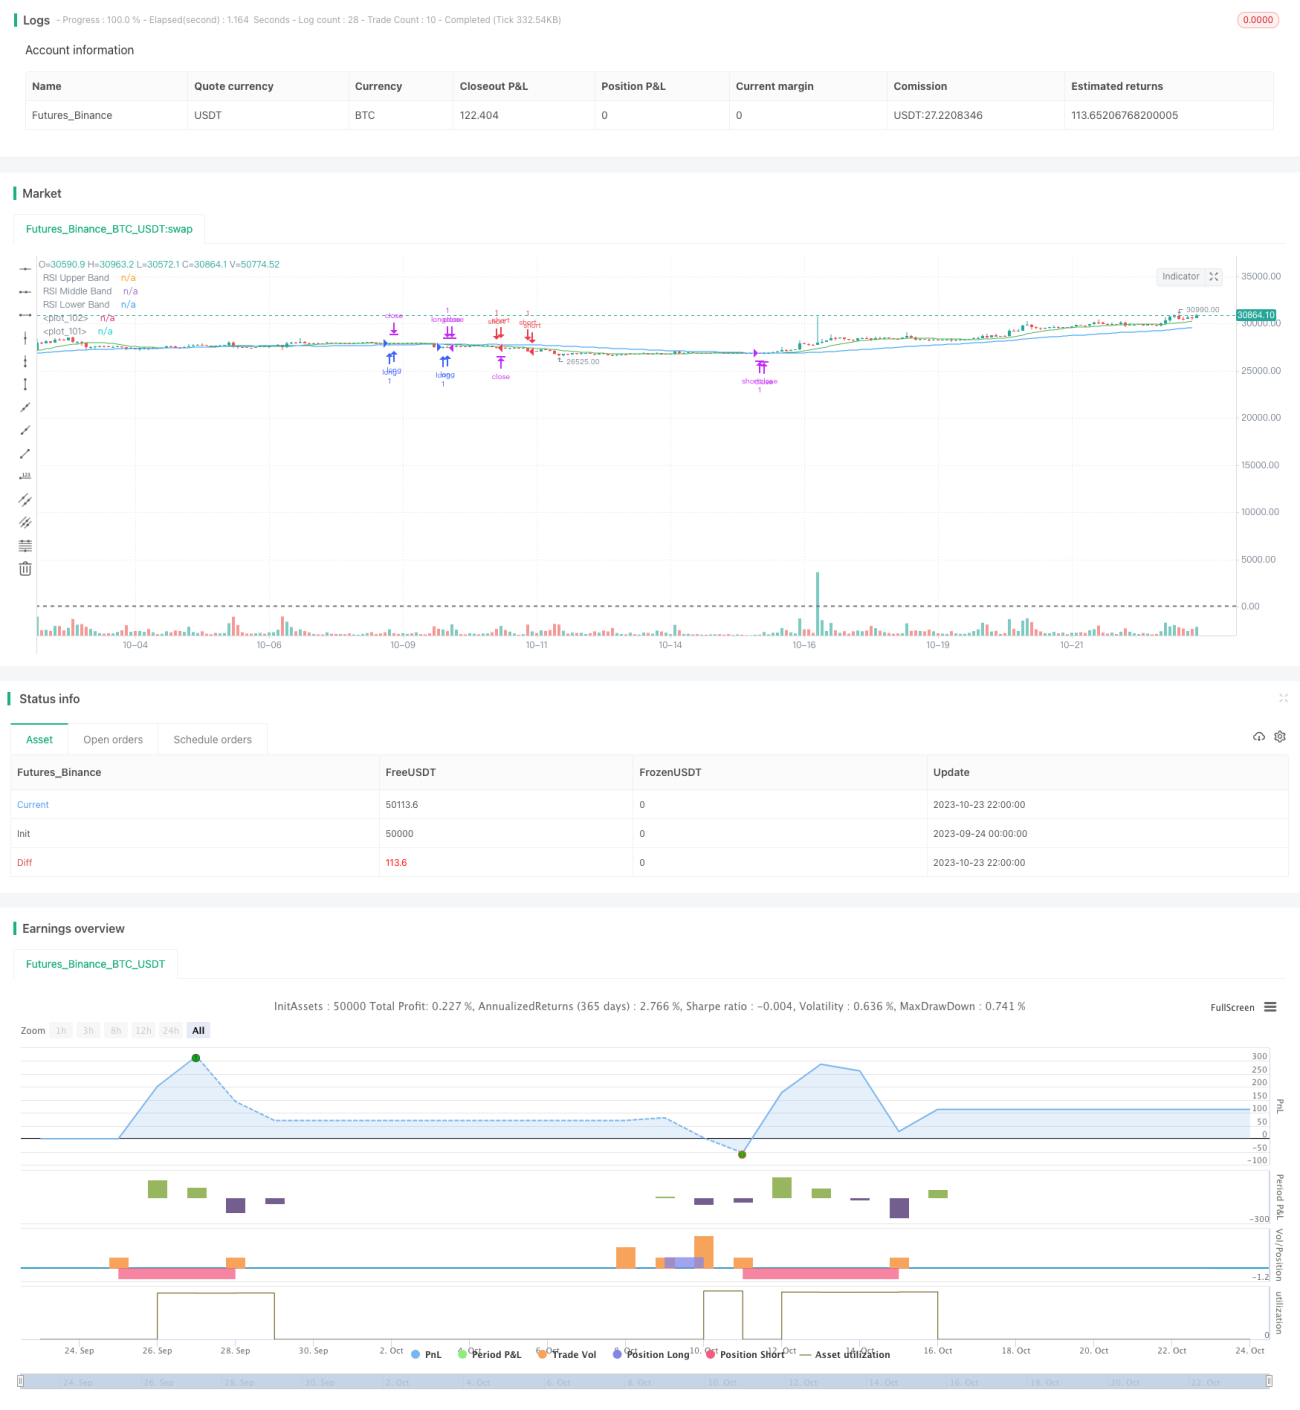
/*backtest
start: 2023-09-24 00:00:00
end: 2023-10-24 00:00:00
period: 2h
basePeriod: 15m
exchanges: [{"eid":"Futures_Binance","currency":"BTC_USDT"}]
*/

// This source code is subject to the terms of the Mozilla Public License 2.0 at https://mozilla.org/MPL/2.0/
// © The_Bigger_Bull
//@version=5
strategy("Best TradingView Strategy", overlay=true, margin_long=0, margin_short=0)- 1