Multi-Factor Strategy Combination

这里是我根据你提供的交易策略代码撰写的详细策略分析文章:
Overview
This strategy combines multiple factors to form a comprehensive trading strategy. It aims to leverage the advantages of different factors, including:
- Stoch.RSI - Stochastic RSI
- RSI - Relative Strength Index
- Double Strategy - Combination of Stochastic and RSI
- CM Williams Vix Fix - Finds market bottoms
- DMI - Directional Movement Index
By combining multiple factors, it seeks to capitalize on the strengths of each factor and reduce the risks associated with relying on a single factor.
Strategy Logic
The main technical indicators used in this strategy are:
-
Stoch.RSI - A stochastic oscillator applied to RSI values rather than price. It identifies overbought/oversold levels.
-
RSI - Relative Strength Index, gauges overbought/oversold conditions. Above 70 is overbought, below 30 is oversold.
-
Double Strategy - Combines Stochastic and RSI for trading signals. Buy when Stochastic %K crosses below %D and RSI crosses below oversold level. Sell when the opposite occurs.
-
CM Williams Vix Fix - Calculates percentile range of price volatility over lookback period. Signals potential reversals when threshold is breached.
-
DMI - Directional Movement Index. Uses +DI/-DI differential to determine trend direction/strength.
By integrating signals from these indicators, the strategy provides a more robust system to identify trends and turning points.
Advantages
- Diversification through multiple factors, offset individual weaknesses
- Provides both trend-following and mean-reversion signals
- Identifies overbought/oversold extremes and reversals
- Optimized parameters tailored for different market regimes
- Incorporates trend direction/strength filter
Risks
- Overall robustness of multifactor systems remains unproven
- Potential redundancy between some indicators
- Unclear priority between conflicting signals
- Parameter tuning requires rigorous backtesting
- Long holding periods may underperform
Enhancement
- Further filter/optimize the indicator set
- Fine-tune parameters to fit target markets
- Establish clear entry/exit rules
- Incorporate stop loss, profit taking to control risk
- Test impact of holding period on performance
Summary
This strategy combines strengths of Stoch.RSI, RSI, Double Strategy, CM Williams Vix Fix and DMI. It provides more comprehensive signals but also complicates parameter optimization. Further enhancements around optimizing parameters, filtering unique factors, and defining trading rules can improve robustness. Long-term viability and robustness still require rigorous validation. Overall it provides a good example of multifactor systems worth learning from.
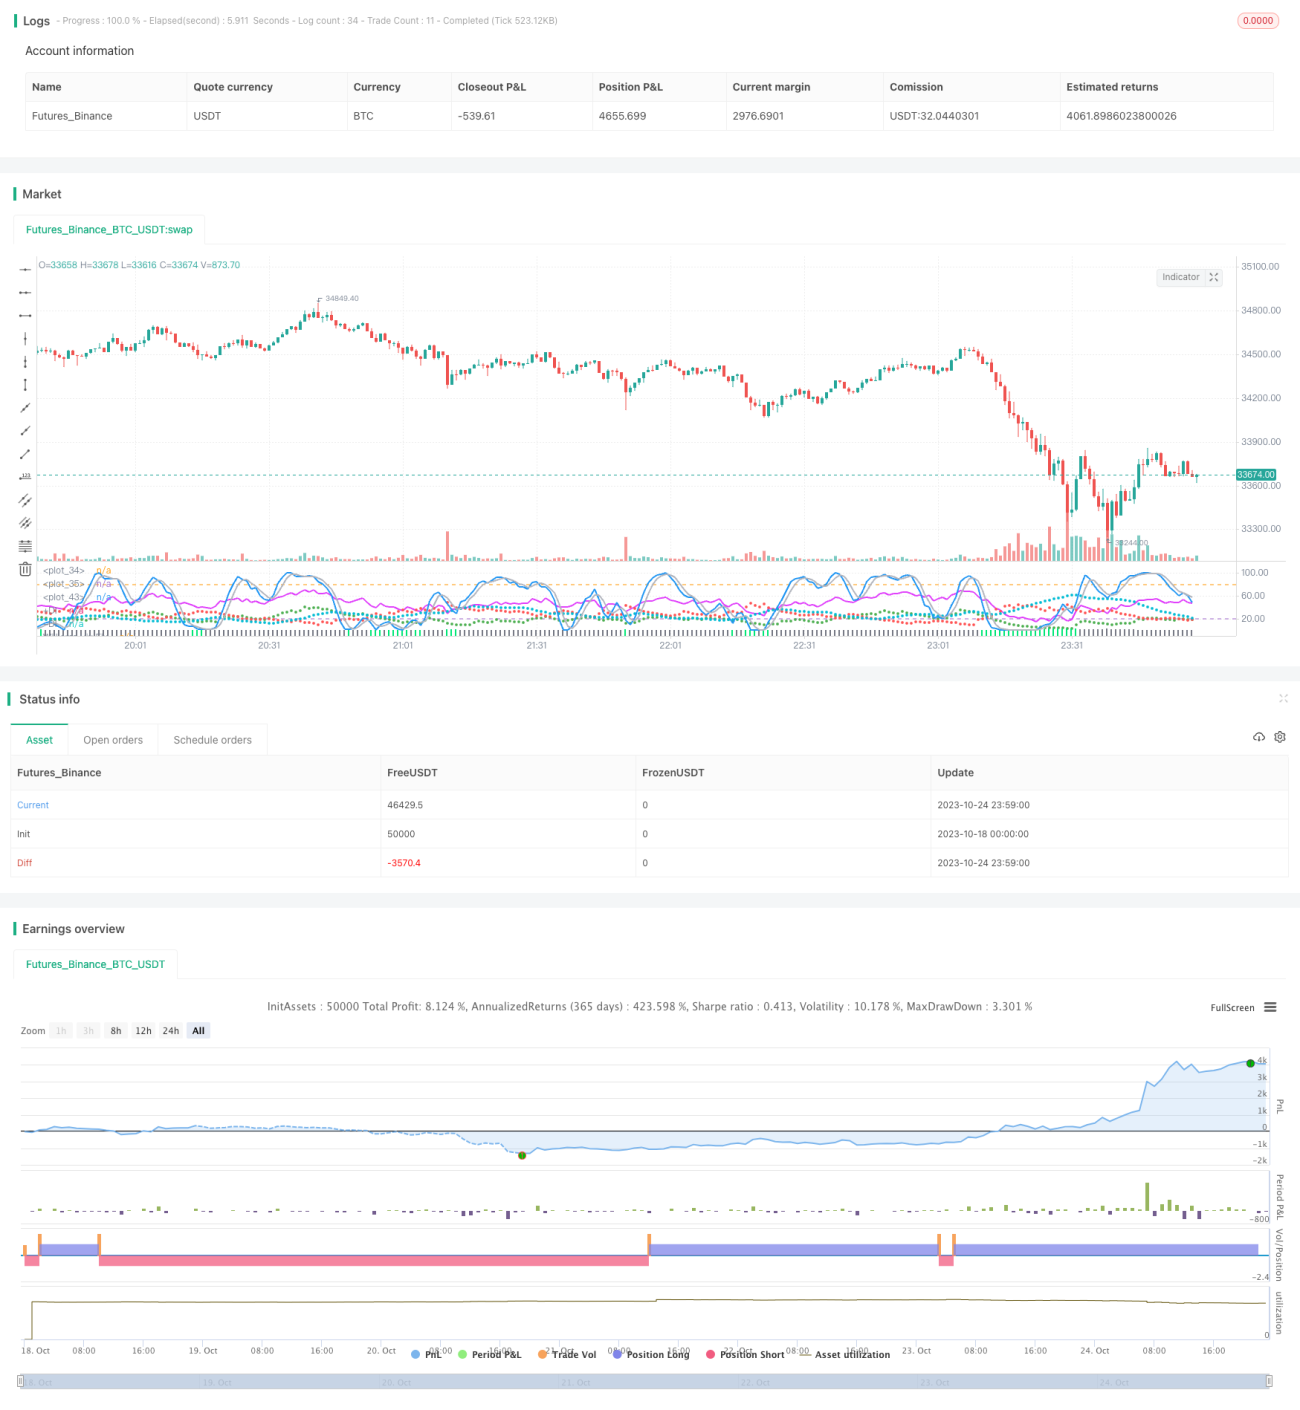
/*backtest
start: 2023-10-18 00:00:00
end: 2023-10-25 00:00:00
period: 1m
basePeriod: 1m
exchanges: [{"eid":"Futures_Binance","currency":"BTC_USDT"}]
*/


     //////////////////////////////////////////////////////////////////////
    ////  STOCHASTIC_RSI+RSI+DOUBLE_STRATEGY+CM_WILLIAMS_VIX_FIX+DMI  ////
//////////////////////////////////////////////////////////////////////- 1