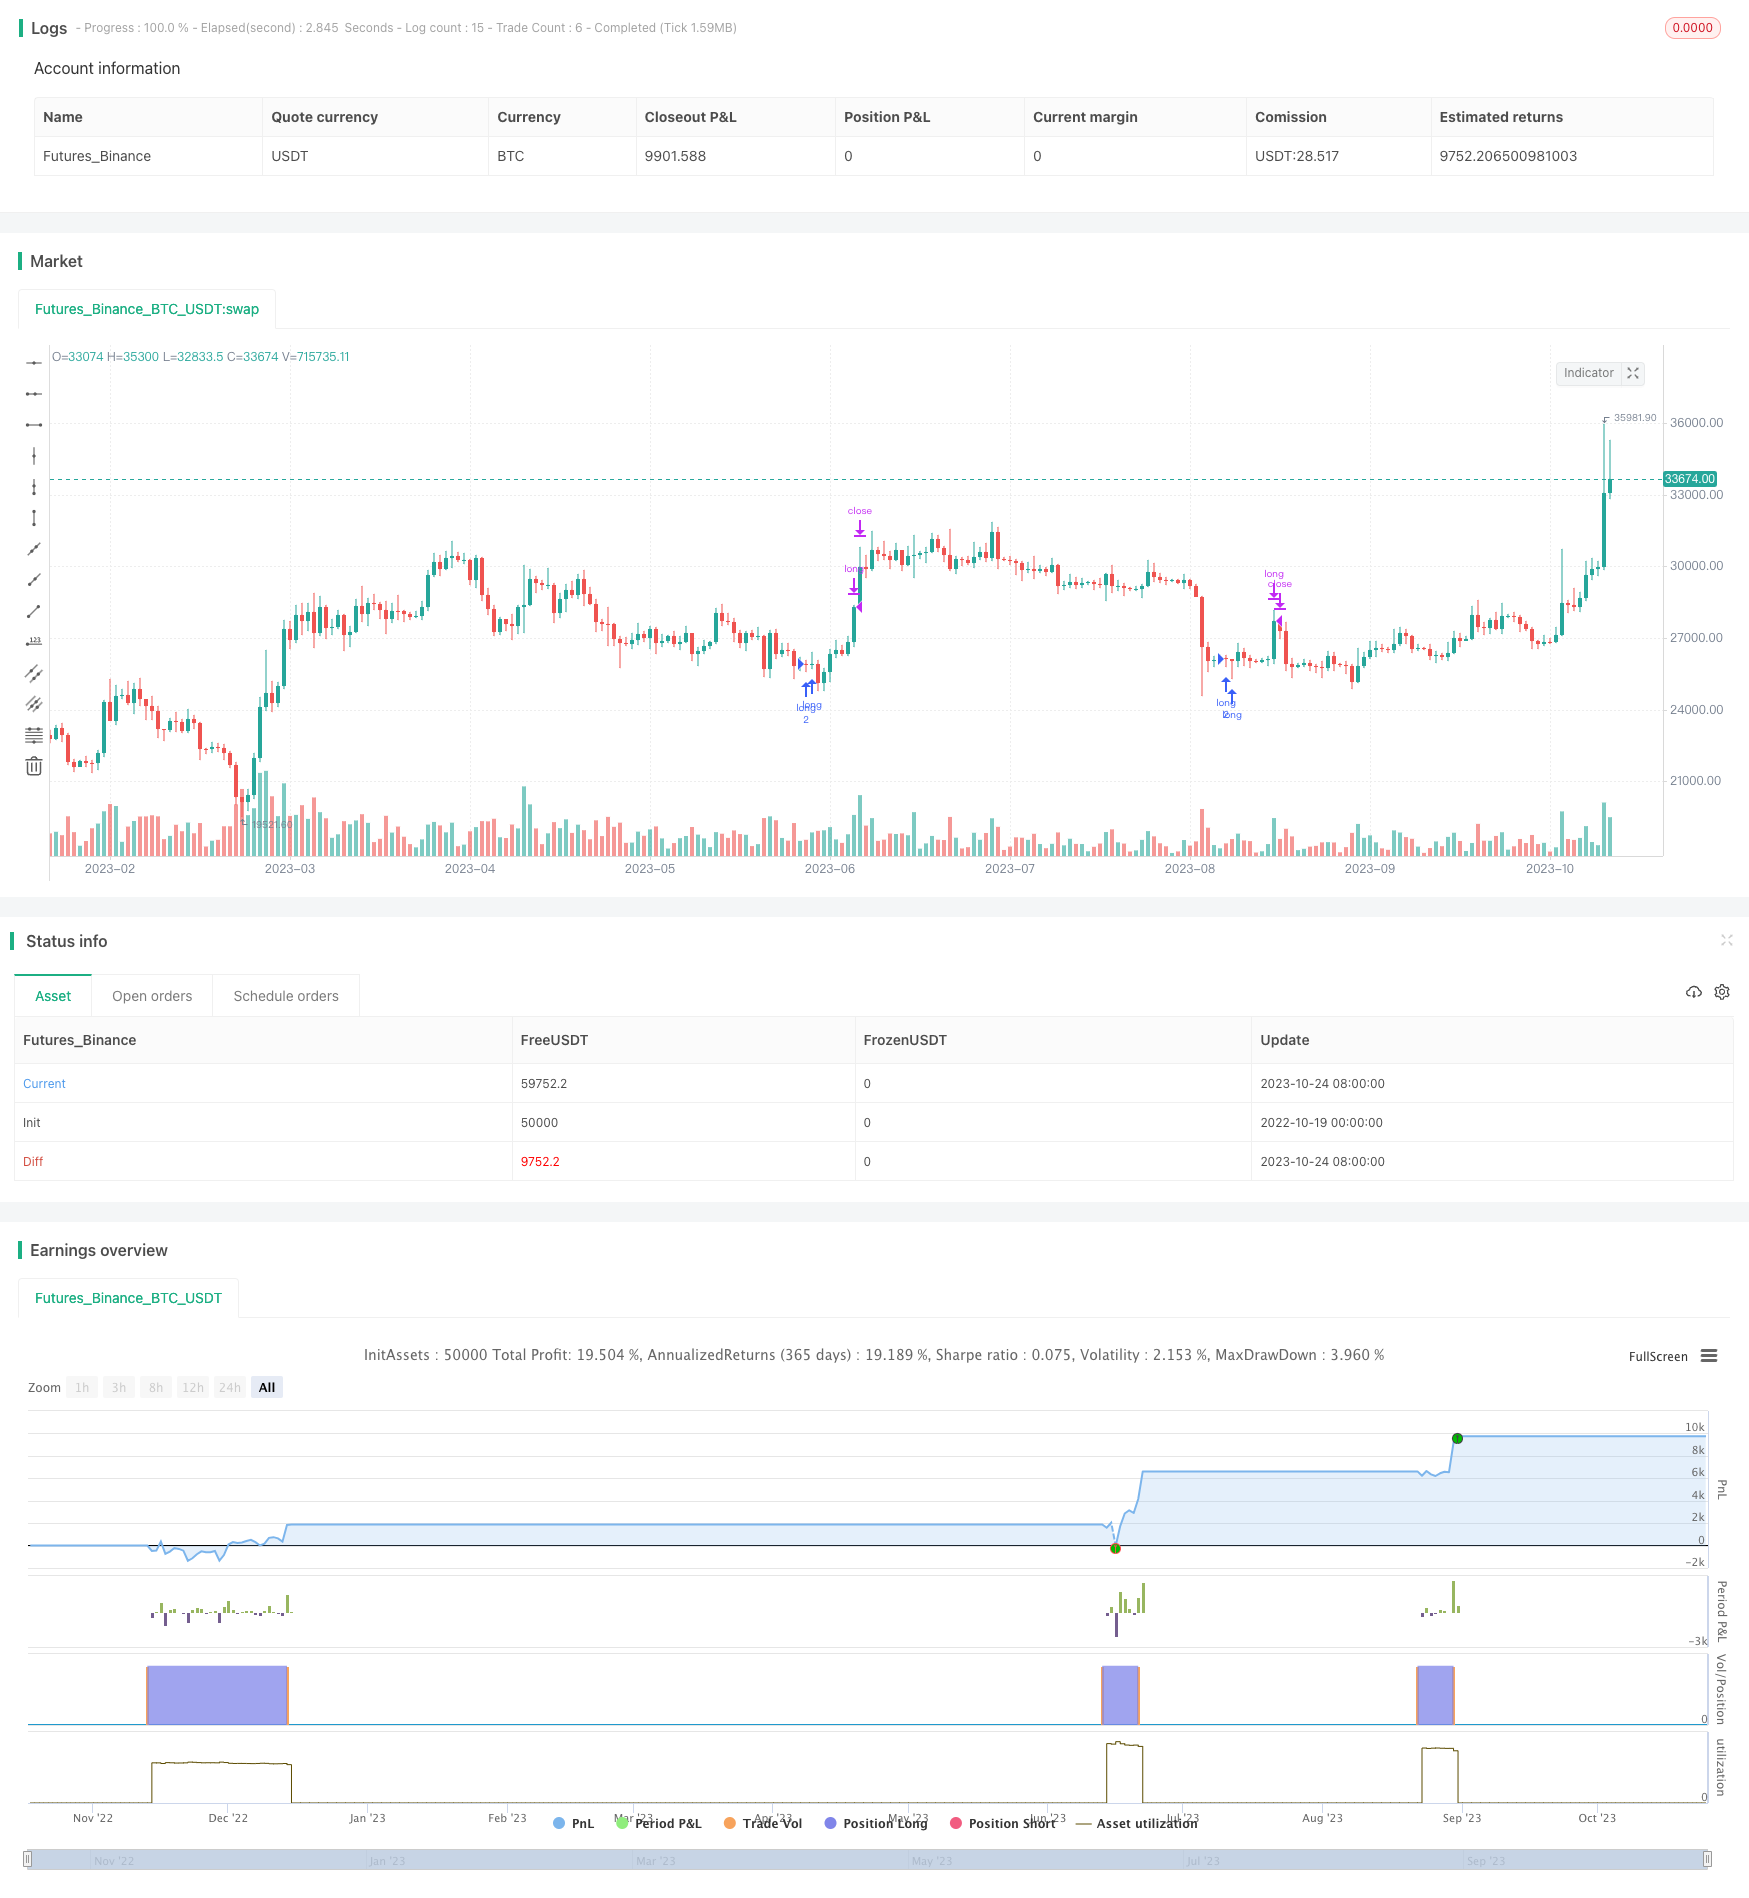
概述
该策略通过组合使用CCI、ADX、AO三个指标来实现多空判断和交易信号产生。其中,CCI用于判断市场是否超买超卖,ADX用于判断趋势方向,AO用于辅助判定震荡市场。多重指标组合可以提高交易系统的稳定性和效率。
策略原理
CCI指标用于判断市场是否超买超卖。当CCI低于-100时为超卖,高于100时为超买。此策略在CCI小于0时做多。
ADX指标判断趋势力度。DI+代表上涨趋势力度,DI-代表下跌趋势力度。ADX代表平均趋势力度。此策略在DI+低于25时做多。
AO指标判断多空动能。AO由快速SMA减去慢速SMA构成。AO上涨代表当前多头力量增强,AO下跌代表空头力量增强。此策略在AO低于0时做多。
综合以上多个指标,形成交易策略为:当CCI < 0 且 DI+ < 25且AO < 0时做多;当DI+ > 25时平仓。
动态计算订单数量为账户权益除以close价格并下取整,实现随账户权益变动调整订单数量。
使用strategy.entry发出做多信号,strategy.close发出平仓信号。
优势分析
使用CCI判断超买超卖状况,可以有效过滤震荡行情带来的虚假信号。
ADX指标判断趋势存在及力度,能够捕捉到较强的趋势信号。
AO指标能帮助判断趋势的热度和动能,避免在震荡行情中交易。
多指标组合可以相互验证信号,增强信号的可靠性,有效减少虚假信号。
动态计算订单数量可以随账户权益变化调整仓位规模,具有较强的资金管理意识。
策略逻辑清晰简单,容易理解和跟踪。
风险分析
CCI指标对vsdk震荡行情识别能力较弱,可能产生错误信号。
ADX指标有滞后性,可能错过趋势转折点。
AO指标对曲折盘整的判断效果不佳。
多指标组合虽可提高信号可靠性,但指标设置不当也可能造成过多过滤导致错失交易机会。
DYNAMICAOR与市场波动性相关,需根据不同品种及市场环境调整参数。
策略回撤可能较大,需要严格资金管理以控制风险。
优化方向
优化CCI参数以识别不同市场的超买超卖区域。
优化ADX参数以捕捉不同品种和市场环境下的趋势转换。
调整AO参数识别不同波动 environments下的真实趋势。
测试不同的指标权重组合,寻找最优参数。
增加止损策略来控制回撤。
结合交易量指标来避免虚假突破。
根据不同品种特点调整固定仓位。
总结
本策略通过CCI、ADX和AO三个指标的组合,形成比较可靠的做多信号。同时结合动态计算订单数量和仓位管理,可以有效控制风险。策略思路简单清晰,容易理解,适合初学者跟踪学习。但该策略对震荡行情识别能力较弱,优化空间还很大,需要进一步测试调整以适应不同品种和市场环境。
/*backtest
start: 2022-10-19 00:00:00
end: 2023-10-25 00:00:00
period: 1d
basePeriod: 1h
exchanges: [{"eid":"Futures_Binance","currency":"BTC_USDT"}]
*/

//@version=3
strategy("Strategy Niel", shorttitle="Strategy Niel", max_bars_back=2000, initial_capital=1000)

//Input variables
buywhenadxabove = input(25)
buywhendiplusbelow = input(10)
buywhenccibelow = input(0)
buywhenawesomeoscillatorbelow = input(0)
sellwhendiplusabove = input(25)

//CCI script
numberofbarsforcci = input(20)
CCI = cci(close,numberofbarsforcci)

//+DI and ADX
adxlen = input(14, title="ADX Smoothing")
dilen = input(14, title="DI Length")
dirmov(len) =>
	up = change(high)
	down = -change(low)
	truerange = rma(tr, len)
	plus = fixnan(100 * rma(up > down and up > 0 ? up : 0, len) / truerange)
	minus = fixnan(100 * rma(down > up and down > 0 ? down : 0, len) / truerange)
	[plus, minus]

adx(dilen, adxlen) =>
	[plus, minus] = dirmov(dilen)
	sum = plus + minus
	adx = 100 * rma(abs(plus - minus) / (sum == 0 ? 1 : sum), adxlen)
	[adx, plus, minus]

[sig, up, down] = adx(dilen, adxlen)

//plot(sig, color=red, title="ADX")
//plot(up, color=blue, title="+DI")
//plot(down, color=orange, title="-DI")


//Awesome Oscillator
nLengthSlow = input(34, minval=1, title="Length Slow")
nLengthFast = input(5, minval=1, title="Length Fast")
xSMA1_hl2 = sma(hl2, nLengthFast)
xSMA2_hl2 = sma(hl2, nLengthSlow)
xSMA1_SMA2 = xSMA1_hl2 - xSMA2_hl2
cClr = xSMA1_SMA2 > xSMA1_SMA2[1] ? blue : red
//plot(xSMA1_SMA2, style=histogram, linewidth=1, color=cClr)

buy = sig > buywhenadxabove and up < buywhendiplusbelow  and CCI < buywhenccibelow and xSMA1_SMA2 < buywhenawesomeoscillatorbelow

ordersize=floor(strategy.equity/close) // Floor returns largest integer, strategy.equity gives total equity remaining - allows to dynamically calculate the order size as the account equity increases or decreases.
strategy.entry("long",strategy.long,ordersize,when= buy) //strategy.entry let's you enter the market variables id ("long"), strategy.long (long position entry), size of the order and when the order should happen
bought = strategy.position_size[0] > strategy.position_size[1]
entry_price = valuewhen(bought, open, 0)
sell = up > sellwhendiplusabove
strategy.close("long", when=sell ) //strategy.close let's you close your position with variables id ('long') and when this should happen