Donchian Channel Adaptive Trend Strategy

Author: ChaoZhang, Date: 2023-10-26 15:58:52
Tags:

img

Overview

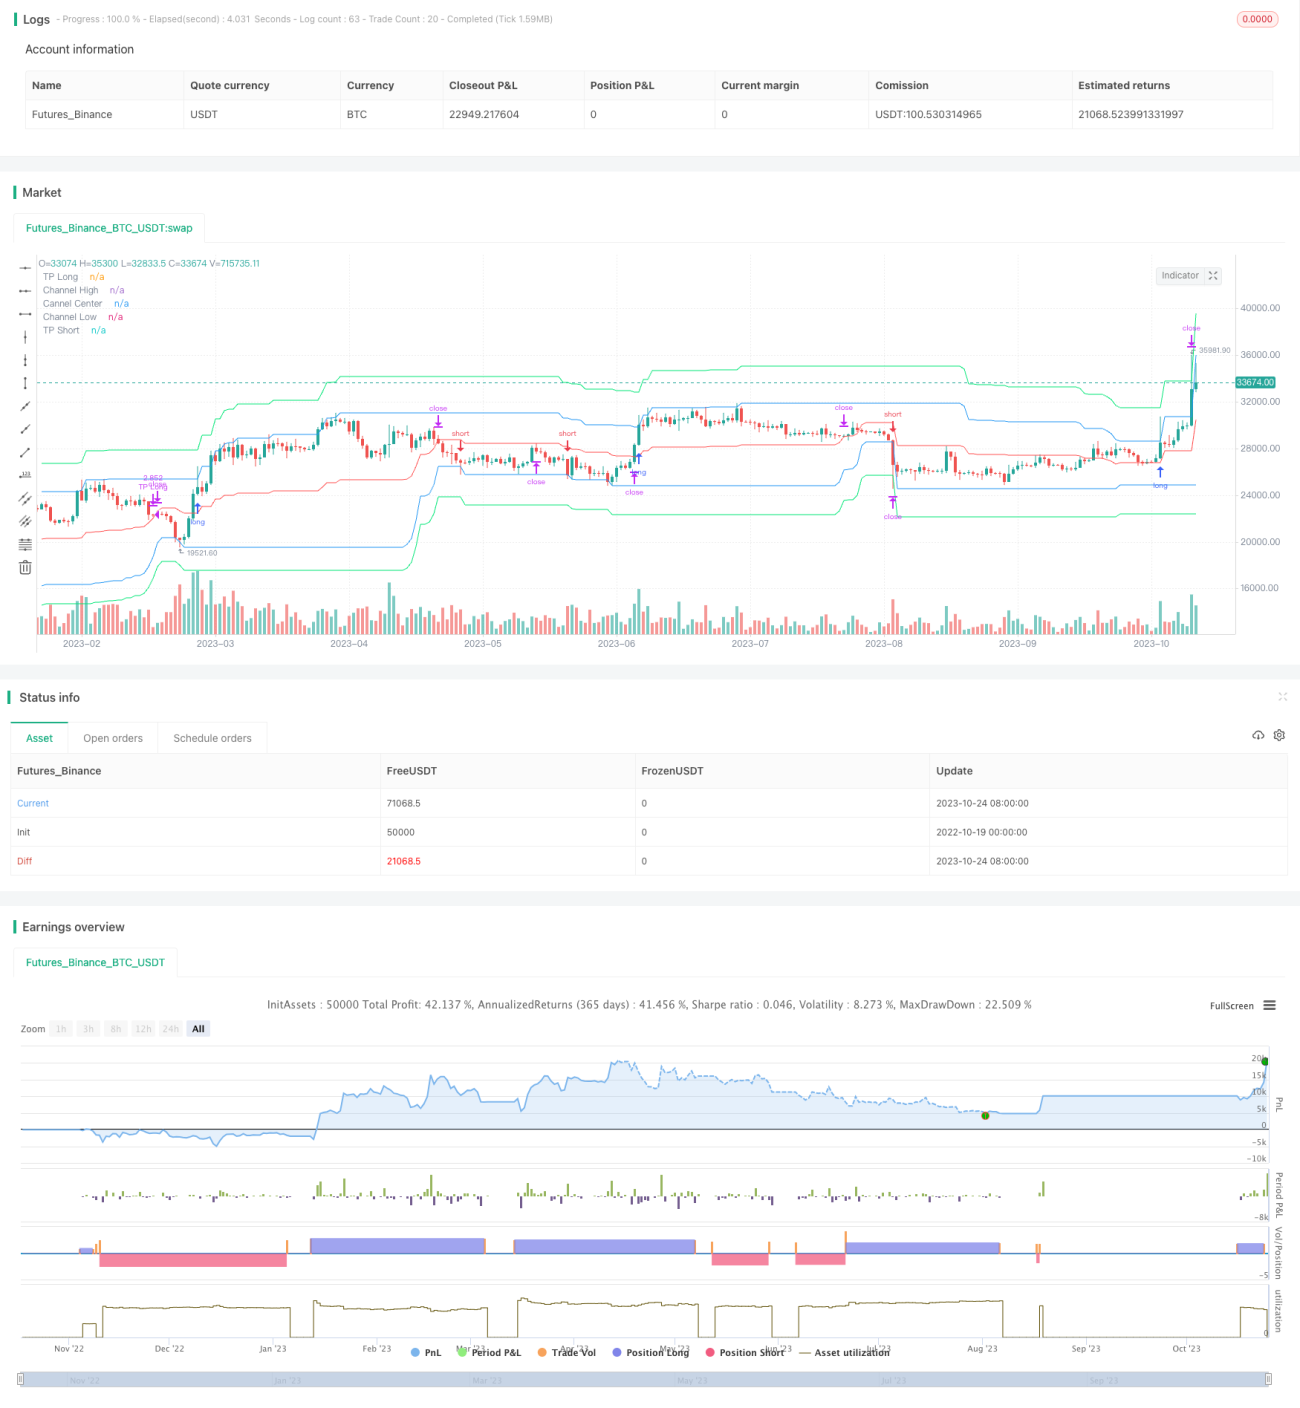
This strategy uses Donchian Channel indicator to adaptively track market trends for trend trading. It follows trends when price breaks through the Donchian Channel and cuts losses when price falls back into the channel.

Strategy Logic

  1. Calculate highest high and lowest low over a certain period to form the Donchian Channel. The middle line of the channel is the average of highest high and lowest low.

  2. Open long position when price breaks above the upper band of the channel. Open short position when price breaks below the lower band.

  3. After opening positions, the stop loss tracks the middle line of the channel. Take profit tracks the price breaking out of the channel by a certain percentage.

  4. Cut losses and close positions when price falls back into the channel.

Advantage Analysis

  1. The strategy utilizes Donchian Channel to determine trend direction and quickly capture breakouts.

  2. Using channel middle line for trailing stop loss protects profits.

  3. Profit target is amplified according to user defined take profit percentage.

  4. It adapts to different market conditions like consolidation, breakout, pullback, etc, and flexibly adjusts position sizing.

  5. Simple and clear trading logic, easy to understand and master.

Risk Analysis

  1. The strategy only trades breakouts and cannot effectively handle consolidation.

  2. Risk of false breakout signals exists, other indicators required for verification.

  3. Improper stop loss and take profit settings may lead to premature exiting or insufficient profit.

  4. Wrong channel period setting affects accuracy of trading signals.

  5. Excessive position sizing amplifies market fluctuation risks.

  6. Unexpected robot interruption risks exist, ensure system reliability.

Enhancement Directions

  1. Add volume indicators to avoid chasing false breakouts.

  2. Increase trend indicator filters to improve entry signal accuracy.

  3. Optimize dynamic stop loss and take profit algorithms.

  4. Adjust position sizing strategy based on real-time market conditions.

  5. Research overnight and pre-market data for better entry timing.

  6. Test different parameter periods to find optimal combinations.

  7. Add model validation to prevent overfitting.

Conclusion

Overall this is a simple and practical adaptive trend following strategy. It has advantages like quickly capturing trend breakouts and protecting profits. It also has disadvantages like ineffectiveness during consolidation and losses from false breakouts. Future improvements lie in incorporating more signal filtering, dynamic stop loss/take profit, to adapt to more market conditions.


/*backtest
start: 2022-10-19 00:00:00
end: 2023-10-25 00:00:00
period: 1d
basePeriod: 1h
exchanges: [{"eid":"Futures_Binance","currency":"BTC_USDT"}]
*/

//Noro
//2020

//@version=4
strategy(title = "Noro's Donchian Strategy", shorttitle = "Donchian str", overlay = true, default_qty_type = strategy.percent_of_equity, initial_capital = 100, default_qty_value = 100, commission_value = 0.1)

//Settings
needlong = input(true, defval = true, title = "Long")
needshort = input(true, defval = true, title = "Short")
tp = input(defval = 10, minval = 1, title = "Take profit")
lotsize = input(100, defval = 100, minval = 1, maxval = 10000, title = "Lot, %")
pclen = input(50, minval = 1, title = "Price Channel Length")
showll = input(true, defval = true, title = "Show lines")
showbg = input(false, defval = false, title = "Show Background")
showof = input(true, defval = true, title = "Show Offset")
fromyear = input(1900, defval = 1900, minval = 1900, maxval = 2100, title = "From Year")
toyear = input(2100, defval = 2100, minval = 1900, maxval = 2100, title = "To Year")
frommonth = input(01, defval = 01, minval = 01, maxval = 12, title = "From Month")
tomonth = input(12, defval = 12, minval = 01, maxval = 12, title = "To Month")
fromday = input(01, defval = 01, minval = 01, maxval = 31, title = "From day")
today = input(31, defval = 31, minval = 01, maxval = 31, title = "To day")

//Price Channel
h = highest(high, pclen)
l = lowest(low, pclen)
center = (h + l) / 2
tpl = h * (100 + tp) / 100
tps = l * (100 - tp) / 100

//Lines
tpcol = showll ? color.lime : na
pccol = showll ? color.blue : na
slcol = showll ? color.red : na
offset = showof ? 1 : 0
plot(tpl, offset = offset, color = tpcol, title = "TP Long")
plot(h, offset = offset, color = pccol, title = "Channel High")
plot(center, offset = offset, color = slcol, title = "Cannel Center")
plot(l, offset = offset, color = pccol, title = "Channel Low")
plot(tps, offset = offset, color = tpcol, title = "TP Short")

//Background
size = strategy.position_size
bgcol = showbg == false ? na : size > 0 ? color.lime : size < 0 ? color.red : na
bgcolor(bgcol, transp = 70)

//Trading
truetime = time > timestamp(fromyear, frommonth, fromday, 00, 00) and time < timestamp(toyear, tomonth, today, 23, 59)
lot = 0.0
lot := size != size[1] ? strategy.equity / close * lotsize / 100 : lot[1]
mo = 0
mo := strategy.position_size != 0 ? 0 : high >= center and low <= center ? 1 : mo[1]
if h > 0
    strategy.entry("Long", strategy.long, lot, stop = h, when = strategy.position_size <= 0 and needlong and truetime and mo)
    strategy.exit("TP Long", "Long", limit = tpl, stop = center)
    strategy.entry("Short", strategy.short, lot, stop = l, when = strategy.position_size >= 0 and needshort and truetime and mo)
    strategy.exit("TP Short", "Short", limit = tps, stop = center)
if time > timestamp(toyear, tomonth, today, 23, 59)
    strategy.close_all()
    strategy.cancel("Long")
    strategy.cancel("Short")

More