Average Stochastic Trading Strategy

Overview
This strategy is based on the Average Stochastic Oscillator for trading signal judgment and belongs to a trend following strategy. It calculates the moving average values of %K and %D of the Average Stochastic Oscillator. When the golden cross occurs, go long. When the death cross occurs, go short. It is a typical trend following strategy.
Strategy Logic
-
Calculate the values of %K and %D of the Average Stochastic Oscillator. %K is the moving average of random values calculated based on closing prices over a certain period, reflecting the relative position of the current price to the highest and lowest prices over a certain period. %D is the moving average of %K used to confirm the trend.
-
Exponentially smooth moving average (EMA) is applied to %K and %D respectively to obtain the average values _avg_k and _avg_d of the Average Stochastic Oscillator.
-
Determine trading signals:
-
Buy signal: when _avg_k crosses over _avg_d and _avg_d < 20, go long.
-
Sell signal: when _avg_k crosses below _avg_d and _avg_d > 80, go short.
-
-
Position management:
-
Long stop loss: close long when _avg_d > 80
-
Short stop loss: close short when _avg_d < 20
-
-
Allow maximum 3 orders in the same direction, which is a pyramiding strategy.
Advantages
-
Using double moving averages to determine golden cross and death cross can effectively filter false breakouts and improve signal quality.
-
Applying Average Stochastic Oscillator can effectively track price trends.
-
Combining overbought and oversold zones helps avoid frequent trading in range-bound market.
-
Allowing pyramiding can gain more profit in trending market.
-
Stop loss strategy controls single loss.
Risks
-
Dual moving average trading strategies tend to generate frequent trading, which will affect profitability if transaction costs are too high.
-
Using fixed stop loss points may stop loss too early exiting the trend.
-
Too many pyramiding may enlarge the loss.
-
It cannot effectively determine trend reversal points and may lead to large losses when trend reverses.
-
Parameter periods need to be optimized because different periods can lead to very different results.
Optimization
-
Consider introducing trend judgment indicators to avoid counter trend trading.
-
Dynamically adjust stop loss points to fit the trend better.
-
Optimize pyramiding strategy, for example, increase position size progressively.
-
Incorporate other indicators to judge trend reversal and exit profit early.
-
Test parameter optimization separately for different products to improve adaptability.
Summary
In summary, this is a typical trend following strategy. It uses Average Stochastic Oscillator to determine trend direction and pyramids when trend occurs. The advantage is strong tracking ability suitable for trending market. But it is important to avoid counter trend trading. Further optimization can be done by introducing trend judgment, optimizing stop loss strategy, controlling pyramiding times, etc. With proper parameter selection, good tracking results can be achieved.
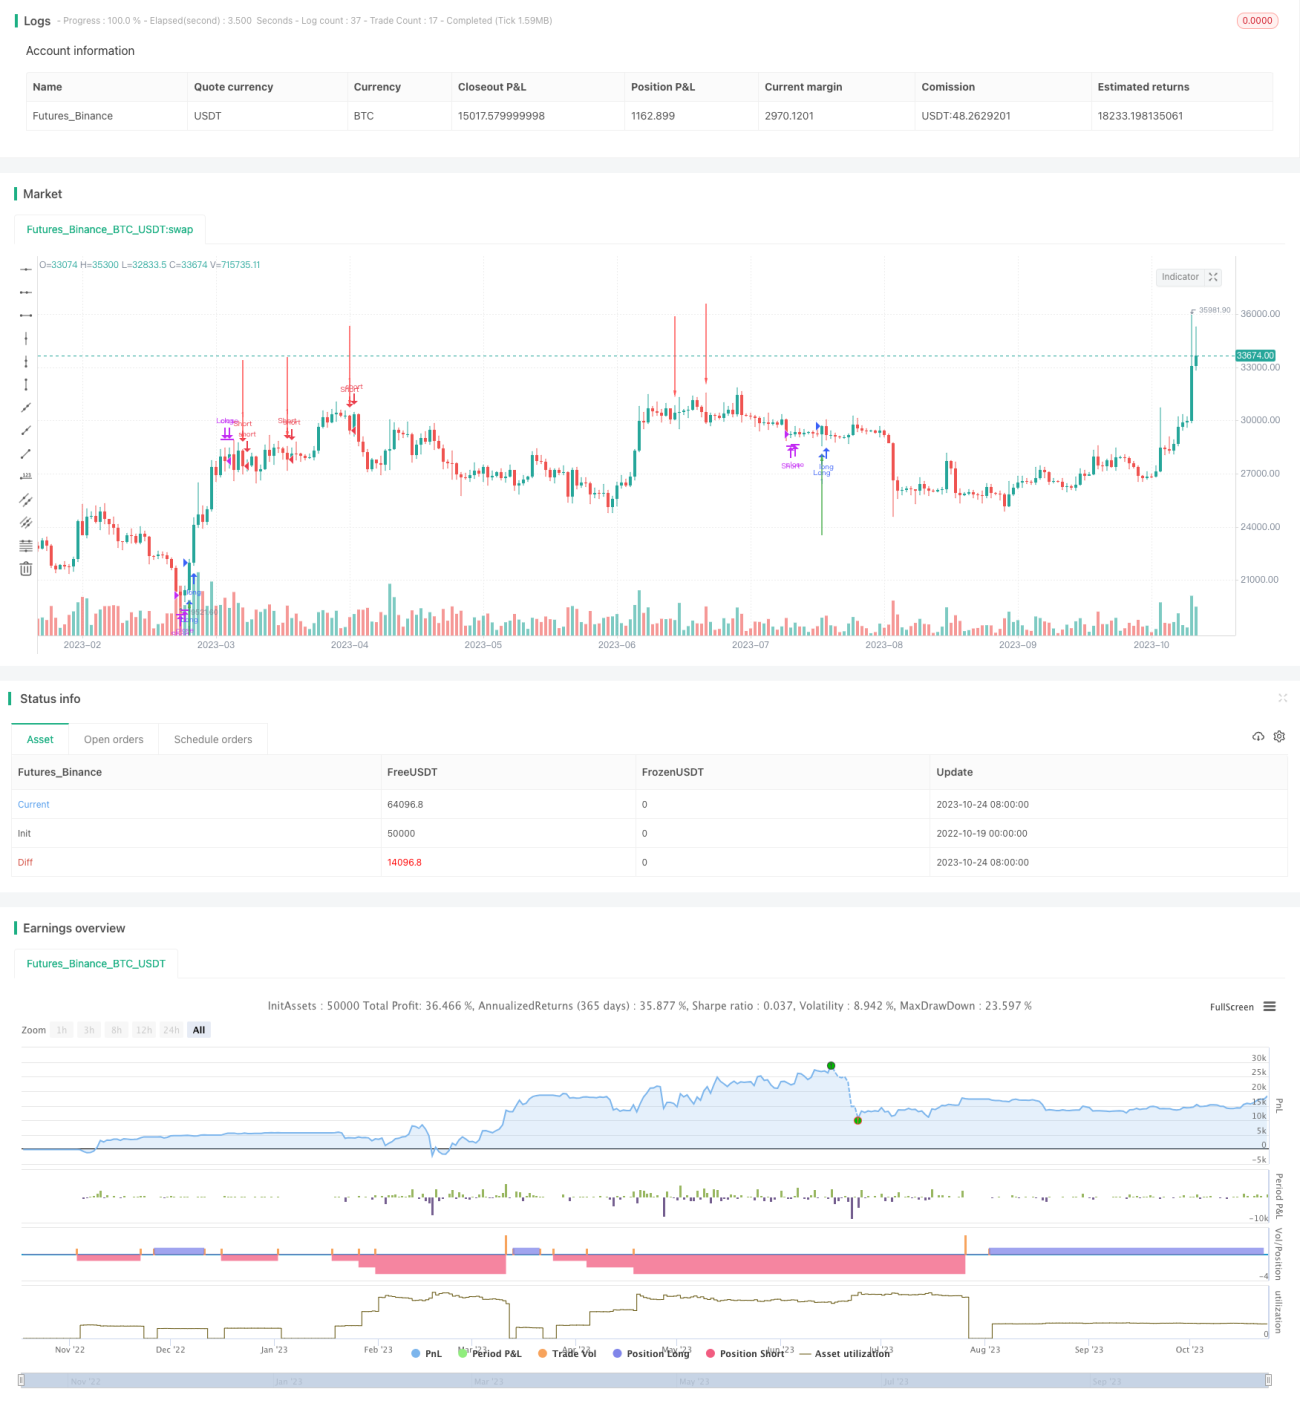
/*backtest
start: 2022-10-19 00:00:00
end: 2023-10-25 00:00:00
period: 1d
basePeriod: 1h
exchanges: [{"eid":"Futures_Binance","currency":"BTC_USDT"}]
*/

//@version=5
//1. AVG Stochastic Calculate
//1.1 AVG %K is calculated by apply EMA with smooth K period on Average of Original Stochastic %k & %d
//+ avg_k=ema((%k+%d)/2,smoothK)- 1