Trend Trading with Double EMA Crossover System

Author: ChaoZhang, Date: 2023-10-26 17:15:46
Tags:

img

Overview

The Double EMA Crossover system is a trend following trading system based on two exponential moving averages (EMAs). It uses two EMAs with different periods to determine the current trend direction and generate trading signals accordingly. With its simple logic and easy implementation, this system can capture market trends effectively and is suitable for medium to long term traders.

How It Works

The core of this system relies on two EMAs, one faster EMA and one slower EMA. When the fast EMA is above the slow EMA, it is considered bullish. When the fast EMA is below the slow EMA, it is considered bearish.

Based on the price’s relationship with the two EMAs, the bars can be categorized into different trading zones:

  • When fast EMA is above slow EMA and price is above fast EMA (G1), it is a strong buy zone, a long position can be taken here.

  • When fast EMA is below slow EMA and price is below fast EMA (R1), it is a strong sell zone, a short position can be taken here.

  • When the two EMAs cross, the warning (yellow) and transition (orange) zones are determined based on the price’s relationship with the two EMAs. These zones indicate potential trend shifts and trades should be taken with caution using additional indicators.

Trading signals are generated when price moves across different zones. In the strong zones G1 and R1, signals can be directly taken. In warning and transition zones, additional indicator confirmation is required.

StochRSI is also implemented to assist with identifying potential entry and exit points. Oversold and overbought readings from StochRSI can provide additional buy and sell signals.

Advantages

  • Simple and clean logic that is easy to understand and implement

  • Effectively catches medium to long term trends

  • Distinguishes strong zones from warning/transition zones, producing reliable trade signals

  • StochRSI inclusion further improves entry and exit timing

Risks

  • As a pure trend following system, performance may suffer in non-trending markets

  • Inappropriate EMA period settings may cause false signals

  • Warning and transition zones carry higher trading risks and should be treated with caution

  • Lack of stop loss may lead to accentuated losses

The risks can be reduced by:

  1. Selecting strongly trending instruments and pausing trading when trend is weak

  2. Optimizing EMA periods to minimize false signals

  3. Introducing additional indicators for confirmation in warning/transition zones

  4. Implementing stop loss to control loss per trade

Enhancement Opportunities

The system can be further improved in the following areas:

  1. Incorporate more indicators like MACD, KDJ for signal confirmation

  2. Add filters such as volume expansion in trading zones to improve trade success rate

  3. Dynamically adjust EMA periods based on market conditions for optimized parameters

  4. Implement stop loss strategies to exit trades at certain loss percentages

  5. Optimize position sizing and money management

  6. Test and fine tune parameters across different instruments to find best configurations

By introducing more signal confirmation, dynamic parameter optimization, stop loss, and proper money management, the system’s robustness can be improved and risks reduced for better results.

Conclusion

The Double EMA Crossover system is a trend following system based on comparing two EMAs. It identifies different trading zones based on price’s relationship with the EMAs to determine trend direction and generate trading signals. As a system with clear logic and easy implementation, it can effectively capture trends. While risks exist, they can be reduced through auxiliary indicators, dynamic optimization, stop loss, and money management. Overall, the Double EMA Crossover system is a solid trend following system suitable for medium to long term traders.
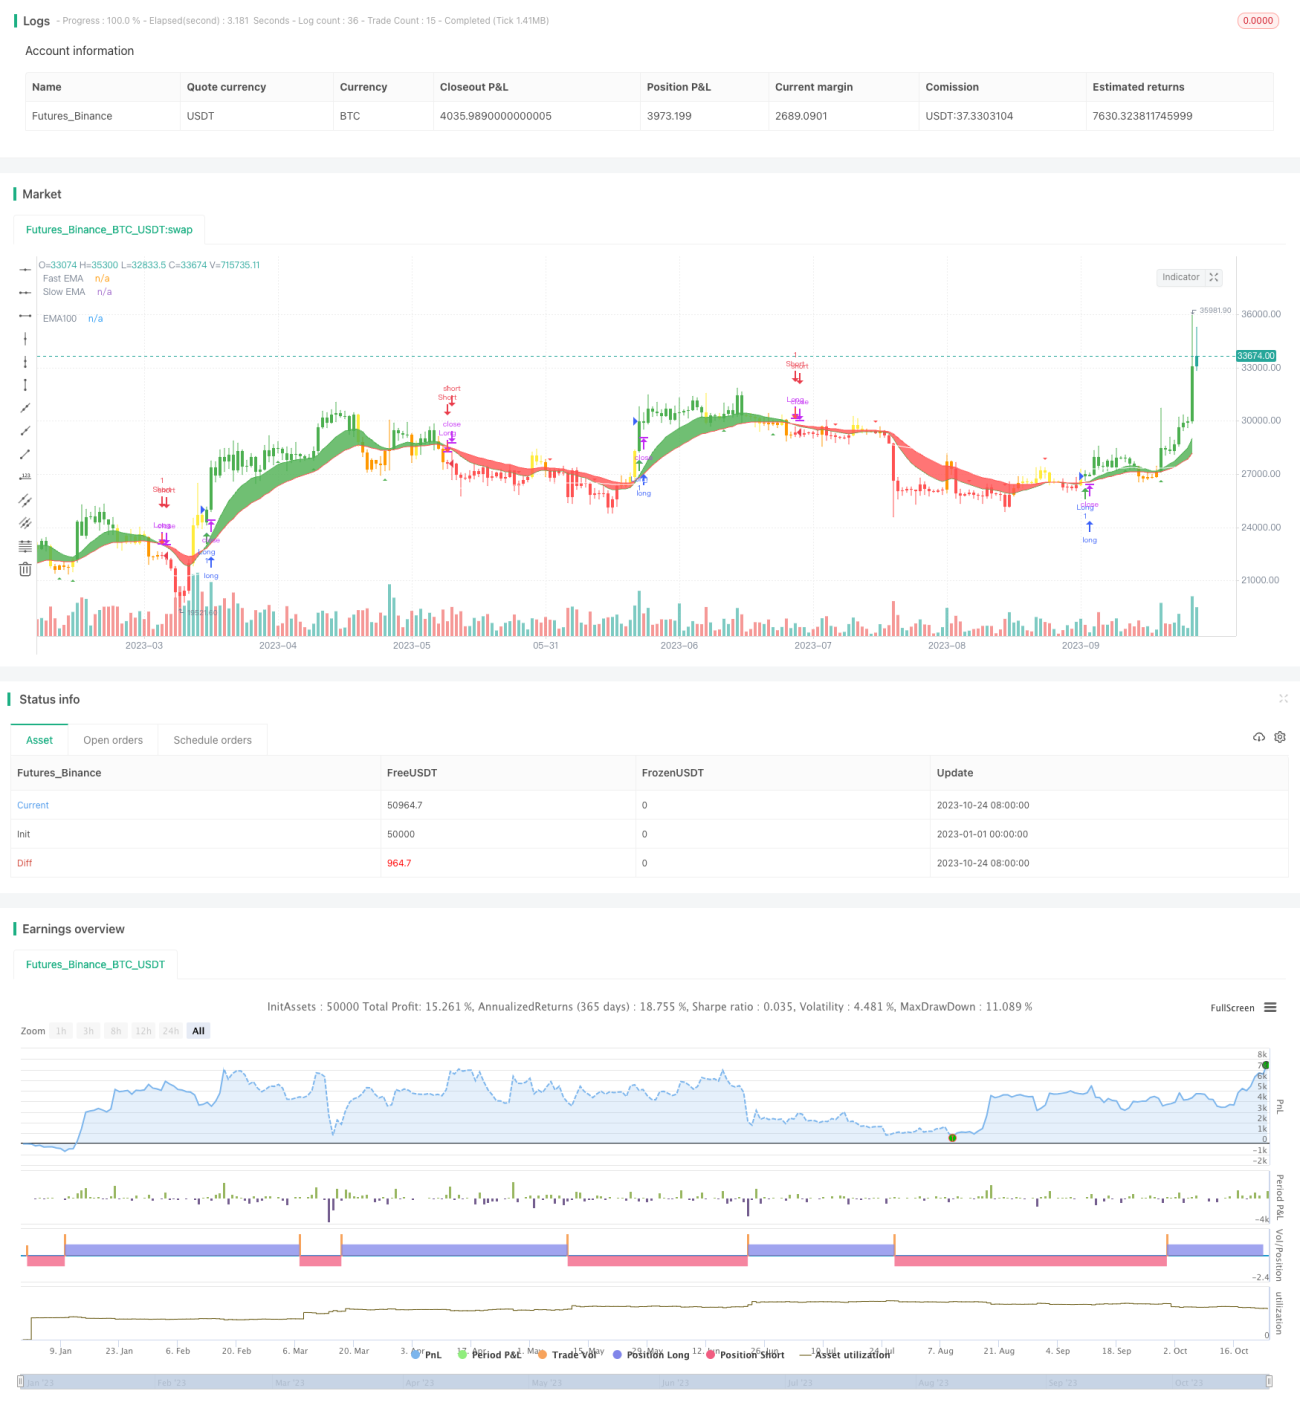

/*backtest
start: 2023-01-01 00:00:00
end: 2023-10-25 00:00:00
period: 1d
basePeriod: 1h
exchanges: [{"eid":"Futures_Binance","currency":"BTC_USDT"}]
*/

// This source code is subject to the terms of the Mozilla Public License 2.0 at https://mozilla.org/MPL/2.0/
// © Vvaz_
//base-on CDC ActionZone By Piriya   a simple 2EMA and is most suitable for use with medium volatility market
//@version=4
strategy(title="Vin's Playzone" ,shorttitle="VPz", overlay=true, margin_long=4, margin_short=2)

//variable
srcf = input(title="Source",type=input.source,defval=close)
tffix = input(title="Fixed Timeframe",type=input.bool,defval=true)
tfn = input(title="Timeframe in",type=input.resolution,defval="D")
ema1 = input(title="Fast EMA",type=input.integer,defval=12)
ema2 = input(title="Slow EMA",type=input.integer,defval=26)
ema3 = input(title="EMA 100",type=input.bool,defval=true)
smooter =input(title="Smoothing period (1 = no smoothing)",type=input.integer,defval=2)
fillbar =input(title="Fill Bar Color",type=input.bool,defval=true)
emasw = input(title="Show EMA",type=input.bool,defval=true)
bssw = input(title="Show Buy-Sell signal",type=input.bool,defval=true)
plotmm = input(title="Show Buy-Sell Momentum",type=input.bool,defval=true)
plotmmsm = input(title="RSI Smoothing",type=input.integer,defval=0,minval=0,maxval=2)

//math
xcross =ema(srcf,smooter)
efast = tffix ?  ema(security(syminfo.tickerid,tfn,ema(srcf,ema1), gaps = barmerge.gaps_off,lookahead = barmerge.lookahead_on),smooter) :ema(xcross,ema1)
eslow = tffix ?  ema(security(syminfo.tickerid,tfn,ema(srcf,ema2), gaps = barmerge.gaps_off,lookahead = barmerge.lookahead_on),smooter) :ema(xcross,ema2)
ema3x = ema(xcross,100)


//Zone
Bull = efast > eslow
Bear = efast < eslow

G1 = Bull and xcross > efast //buy
G2 = Bear and xcross > efast and xcross > eslow //pre-buy1
G3 = Bear and xcross > efast and xcross < eslow //pre-buy2

R1 = Bear and xcross < efast //sell
R2 = Bull and xcross < efast and xcross < eslow //pre-sell1
R3 = Bull and xcross < efast and xcross > eslow //pre-sell2

//color
bcl =   G1 ? color.green :  G2 ? color.yellow : G3 ? color.orange :R1 ? color.red :R2 ? color.orange : R3 ? color.yellow : color.black
barcolor(color=fillbar ? bcl : na )

//plots
line1 = plot(ema3 ? ema3x : na ,"EMA100",color=color.white)
line2 = plot(emasw ? efast : na ,"Fast EMA",color=color.green)
line3 = plot(emasw ? eslow : na ,"Slow EMA",color=color.red)
fillcl = Bull ? color.green : Bear ? color.red : color.black
fill(line2,line3,fillcl)

//actions
buywhen = G1 and G1[1]==0
sellwhen = R1 and R1[1]==0

bullish = barssince(buywhen) < barssince(sellwhen)
bearish = barssince(sellwhen) < barssince(buywhen)

buy = bearish[1] and buywhen
sell = bullish[1] and sellwhen

bullbearcl = bullish ? color.green : bearish ? color.red : color.black

//plot trend
plotshape(bssw ? buy : na ,style=shape.arrowup,title="BUY",location=location.belowbar,color=color.green)
plotshape( bssw ? sell : na ,style=shape.arrowdown ,title="Sell",location=location.abovebar,color=color.red)

// Momentum Signal using StochRSI

smoothK = input(5,"StochRSI smooth K",type=input.integer,minval=1)
smoothD = input(4,"StochRSI smooth D",type=input.integer,minval=1)
RSIlen = input(14,"RSI length",type=input.integer,minval=1)
STOlen = input(14,"Stochastic length",type=input.integer,minval=1)
SRsrc = input(close,"Source for StochasticRSI",type=input.source)
OSlel = input(20,"Oversold Threshold",type=input.float,minval=0.00)
OBlel = input(80,"Oversold Threshold",type=input.float,minval=0.00)
rsil = rsi(SRsrc,RSIlen)
K = sma(stoch(rsil,rsil,rsil,STOlen),smoothK)
D = sma(K,smoothD)

buymore = iff( bullish ,iff(D < OSlel and crossover(K,D),	2,	 iff(D > OSlel and crossover(K,D),	 1,0)),0)
sellmore = iff( bearish,iff(D > OBlel and crossunder(K,D),	2,	 iff(D < OBlel and crossunder(K,D),	 1,0)),0)
//plot momentum
plotshape(plotmm ? buymore > plotmmsm ? buymore : na : na ,"Buy More!" ,style=shape.triangleup,location=location.belowbar,color=color.green)
plotshape(plotmm ? sellmore > plotmmsm ? sellmore : na : na ,"Sell More!" ,style=shape.triangledown,location=location.abovebar,color=color.red)


// === INPUT BACKTEST RANGE ===
FromYear  = input(defval = 2009, title = "From Year", minval = 2009)
FromMonth = input(defval = 1, title = "From Month", minval = 1, maxval = 12)
FromDay   = input(defval = 1, title = "From Day", minval = 1, maxval = 31)
ToYear    = input(defval = 9999, title = "To Year", minval = 2009)
ToMonth   = input(defval = 12, title = "To Month", minval = 1, maxval = 12)
ToDay     = input(defval = 31, title = "To Day", minval = 1, maxval = 31)

// === FUNCTION EXAMPLE ===
start     = timestamp(FromYear, FromMonth, FromDay, 00, 00)  // backtest start window
finish    = timestamp(ToYear, ToMonth, ToDay, 23, 59)        // backtest finish window
window()  => time >= start and time <= finish ? true : false // create function "within window of time"

//stratgy excuter
strategy.entry("Long",true,when=window() and buy or buymore)
strategy.close("Long",when=window() and sell or sellmore,comment="TP Long")
strategy.entry("Short",false,when=window() and sell or sellmore)
strategy.close("Short",when=window() and buy or buymore,comment="TP Short")


More