Cumulative RSI Breakout Strategy

Overview
This strategy utilizes the Cumulative RSI indicator to identify trends and makes buy and sell decisions when the cumulative RSI value breaks through key threshold levels. It can effectively filter market noise and capture longer-term trend trading opportunities.
Strategy Logic
The strategy is primarily based on the Cumulative RSI indicator for trading decisions. The Cumulative RSI indicator is the accumulation of RSI values. By setting the cumlen parameter, the RSI values over the past cumlen days are added up to derive the Cumulative RSI indicator. This indicator can filter out short-term market noise.
When the Cumulative RSI indicator crosses above the Bollinger Band upper rail, a long position will be opened. When the Cumulative RSI crosses below the Bollinger Band lower rail, the open position will be closed. The Bollinger Band rails are dynamically calculated based on historical data over many years.
Additionally, a trend filter option is added. Long trades will only be opened when the price is above the 100-day Moving Average, meaning it is in an upward trend channel. This filter avoids erroneous trades during market fluctuations.
Advantages
- Effectively filter noise and capture mid-to-long-term trends using Cumulative RSI
- Avoid unreasonable trades with the trend filter
- Use dynamic reference levels instead of fixed values for decision making
- Highly configurable parameters for adjustments based on different markets
- Outstanding backtest results over 10 years, significantly outperforming buy and hold
Risks and Improvements
- Decisions based solely on one indicator, can add other indicators or filters
- Fixed high leverage ratio, can adjust based on drawdowns
- Only long trades, can look into shorting opportunities
- Optimize parameters combinations which vary significantly across markets
- Enrich exit conditions with stop loss, moving stop loss etc.
- Consider combining with other strategies for synergistic effects
Summary
The Cumulative RSI breakout strategy has smooth logic flow and accurately identifies mid-to-long term trends by filtering with Cumulative RSI and adding trend judgment. The backtest results are exceptional over the past decade. There is still room for improvements in areas like parameter tuning, adding indicators, enriching exit conditions to make the strategy more robust. The novel concept is worth further exploration and application.
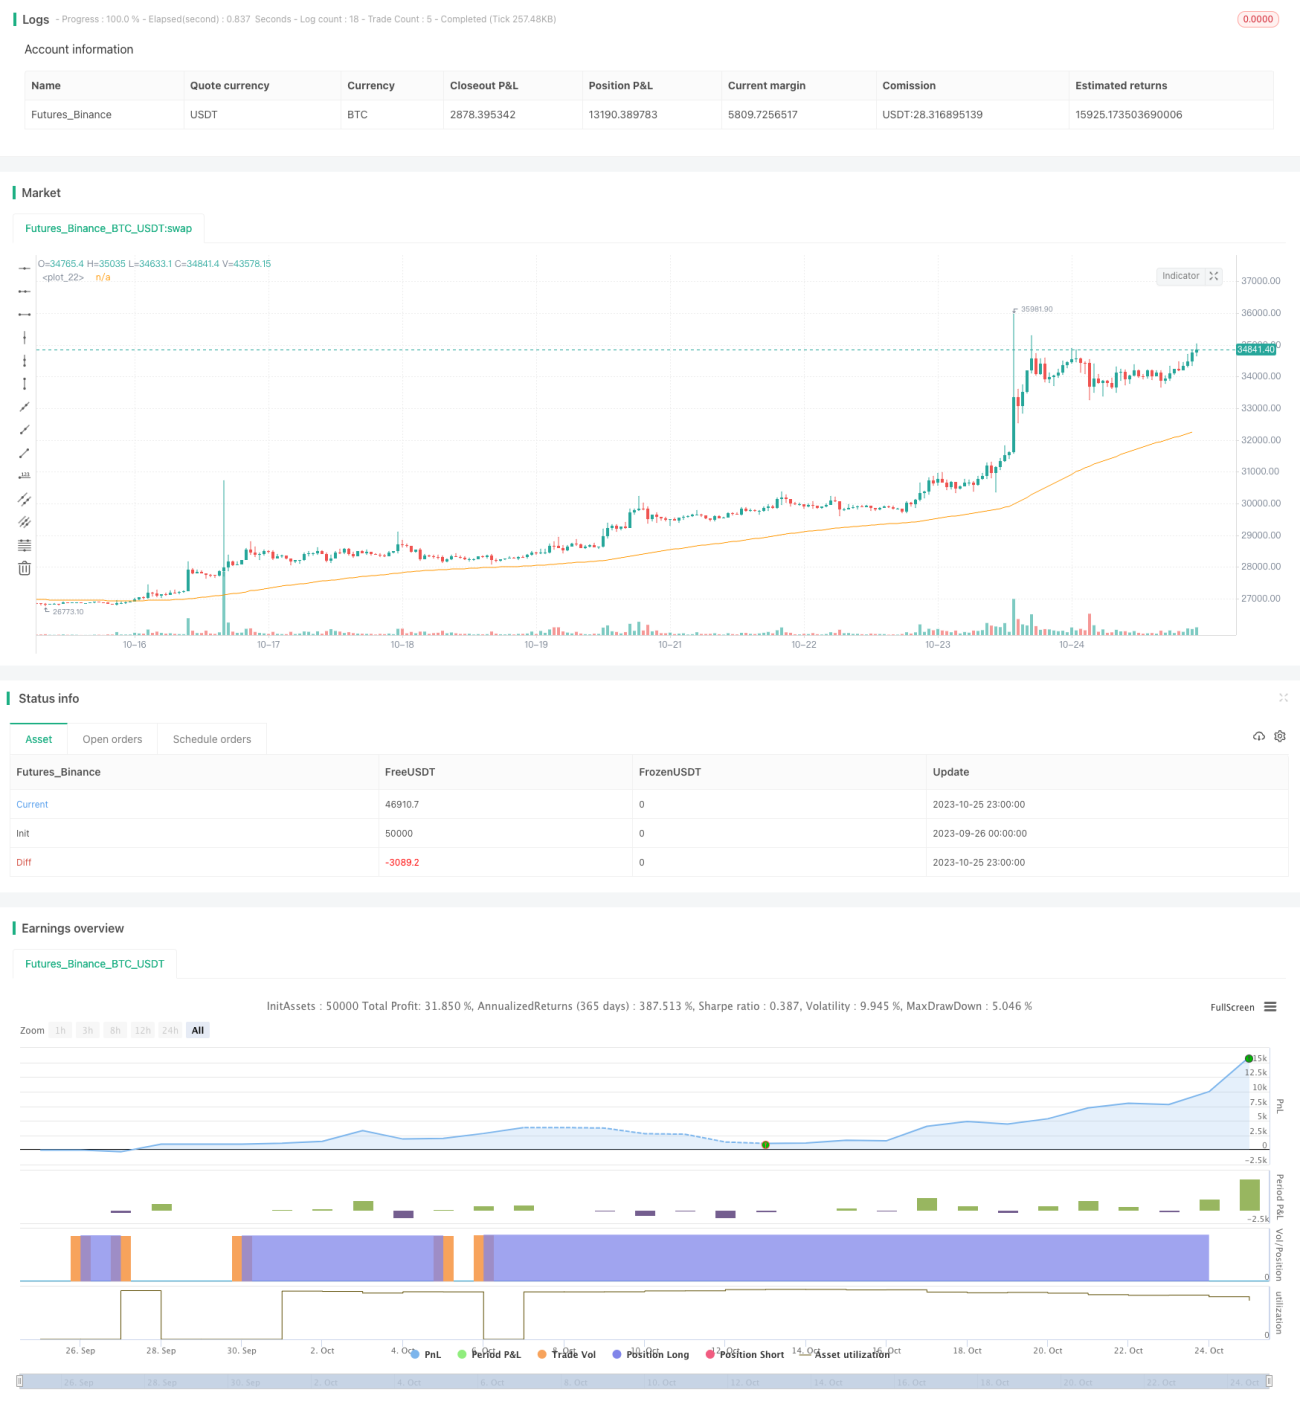
/*backtest
start: 2023-09-26 00:00:00
end: 2023-10-26 00:00:00
period: 1h
basePeriod: 15m
exchanges: [{"eid":"Futures_Binance","currency":"BTC_USDT"}]
*/

// This source code is subject to the terms of the Mozilla Public License 2.0 at https://mozilla.org/MPL/2.0/
// @version=5
// Author = TradeAutomation
- 1