1-3-1 Red Green Candlestick Reversal Strategy

Overview
The 1-3-1 red green candlestick reversal strategy is a strategy that generates buy and sell signals based on candlestick patterns. It looks for buying opportunities when 1 red candlestick is reversed by 3 subsequent green candlesticks.
Principles
The core logic of this strategy is:
- Check if the current candlestick is a red candle, i.e. the close price is lower than the open price
- Check if the previous 3 candlesticks are green candles, i.e. close price is higher than open price
- Check if the last green candle's close price is higher than the previous 2 green candles
- If the above conditions are met, go long at the close of the red candle
- Set stop loss at the lowest price of the red candle
- Set take profit at entry price plus the distance from entry to stop loss
With this strategy, we can buy when the red candle is reversed, because the subsequent trend is likely to be upwards. Stop loss and take profit are set to control risk and lock in profits.
Advantage Analysis
The 1-3-1 red green reversal strategy has the following advantages:
- Simple and clear logic, easy to understand and implement
- Utilizes candlestick pattern features without reliance on indicators, avoiding overoptimization problems
- Has clear entry and exit rules for objective execution
- Sets stop loss and take profit to control risk/reward of each trade
- Good backtest results, likely to translate well to live trading
Risk Analysis
Some risks to note for this strategy:
- Candlestick patterns cannot perfectly predict future moves, some uncertainty exists
- Only one entry, may have lower win rate due to stock specifics
- No consideration of market trend, risk holding during sustained downtrend
- Does not account for trading costs and slippage, actual performance may be worse
Solutions:
- Consider combining with MA etc to filter signals and improve entry success rate
- Adjust position sizing, scale in across multiple entries
- Dynamically adjust stop loss based on market conditions or pause trading
- Test different stop loss/take profit ratios
- Test actual performance including trading costs
Optimization Directions
Some ways this strategy can be optimized:
-
Market index filtering - filter signals based on short/medium term market trend, go long in uptrend and stop trading in downtrend
-
Volume confirmation - only go long if green candle volumes increase
-
Optimize stop loss/take profit ratios - test different ratios to find optimal parameters
-
Position sizing optimization - scale in across multiple entries to reduce single trade risk
-
Add more filters - e.g. MA, volatility etc to ensure high probability entry
-
Machine learning on big data - collect lots of historical data and train optimal parameter thresholds via ML
Conclusion
The 1-3-1 red green reversal strategy is overall a simple and practical short term trading strategy. It has clear entry and exit rules and good backtest results. With some optimization measures, it can become a reliable quant trading strategy. Risk management is also important to manage capital properly.
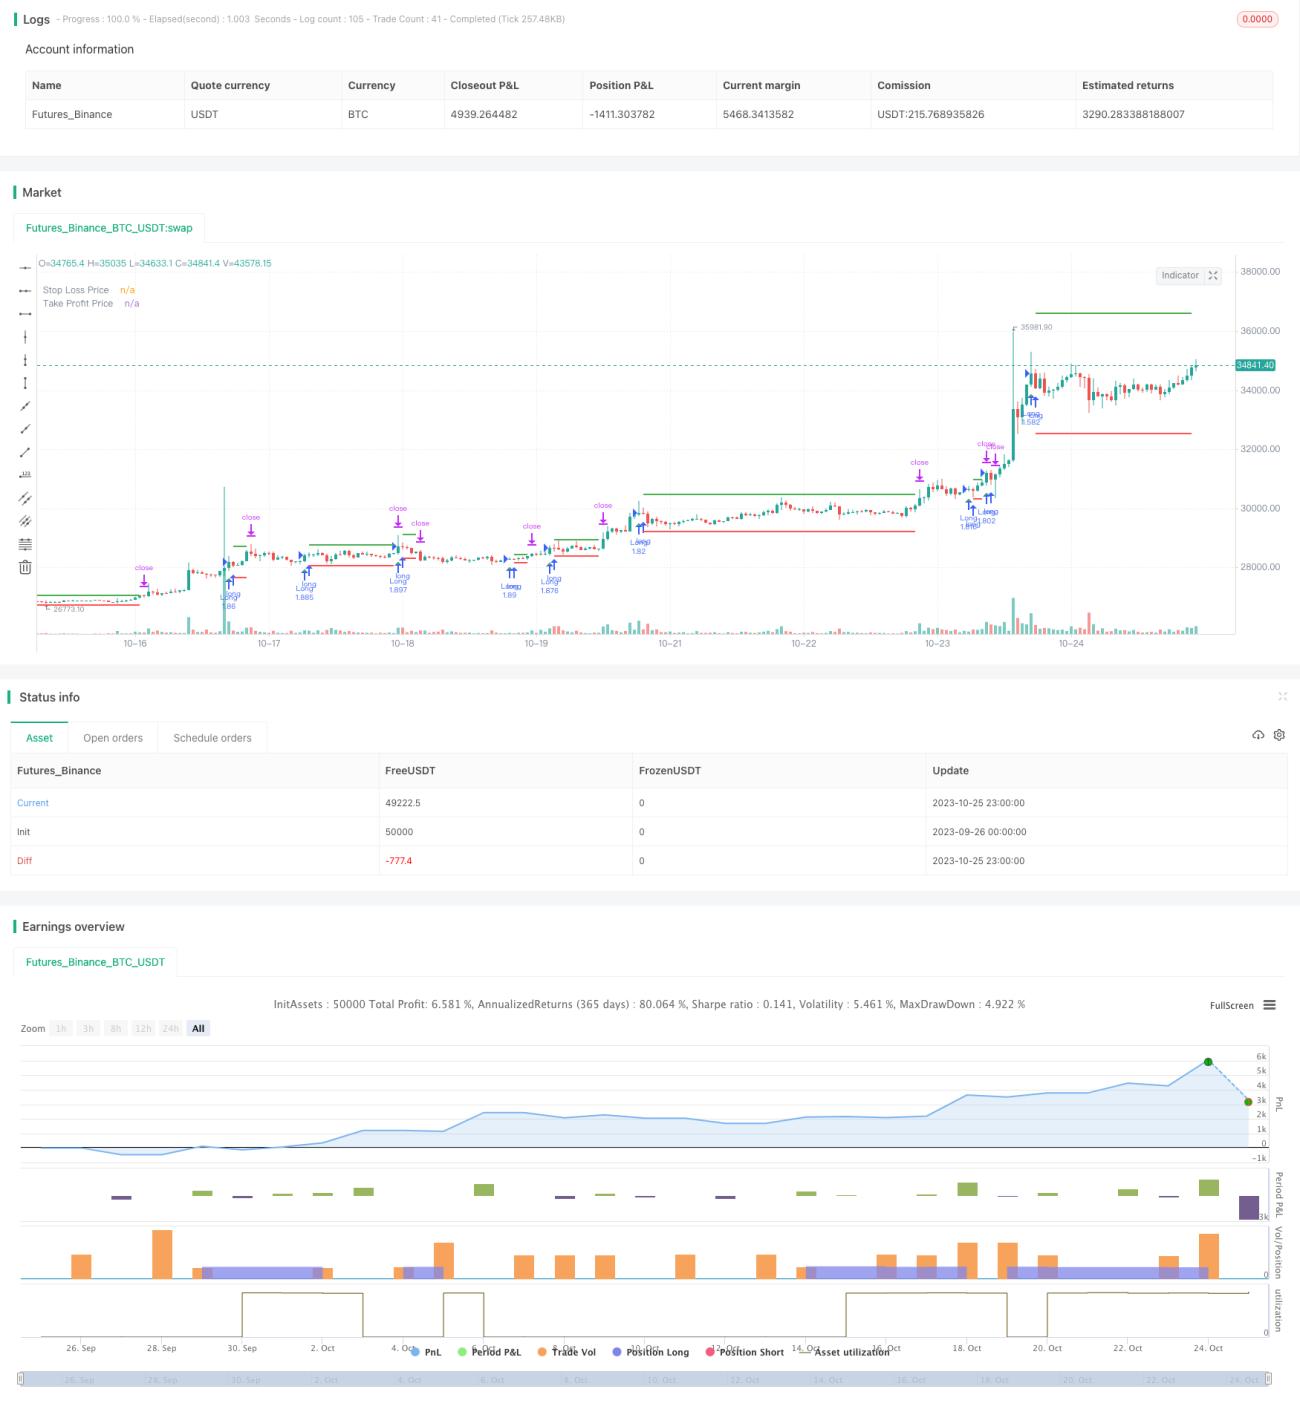
/*backtest
start: 2023-09-26 00:00:00
end: 2023-10-26 00:00:00
period: 1h
basePeriod: 15m
exchanges: [{"eid":"Futures_Binance","currency":"BTC_USDT"}]
*/

//@version=5
//by Genma01
strategy("Stratégie tradosaure 1 Bougie Rouge suivi de 3 Bougies Vertes", overlay=true, default_qty_type = strategy.percent_of_equity,  default_qty_value = 100)
- 1