Reversal Breakout Strategy

Overview
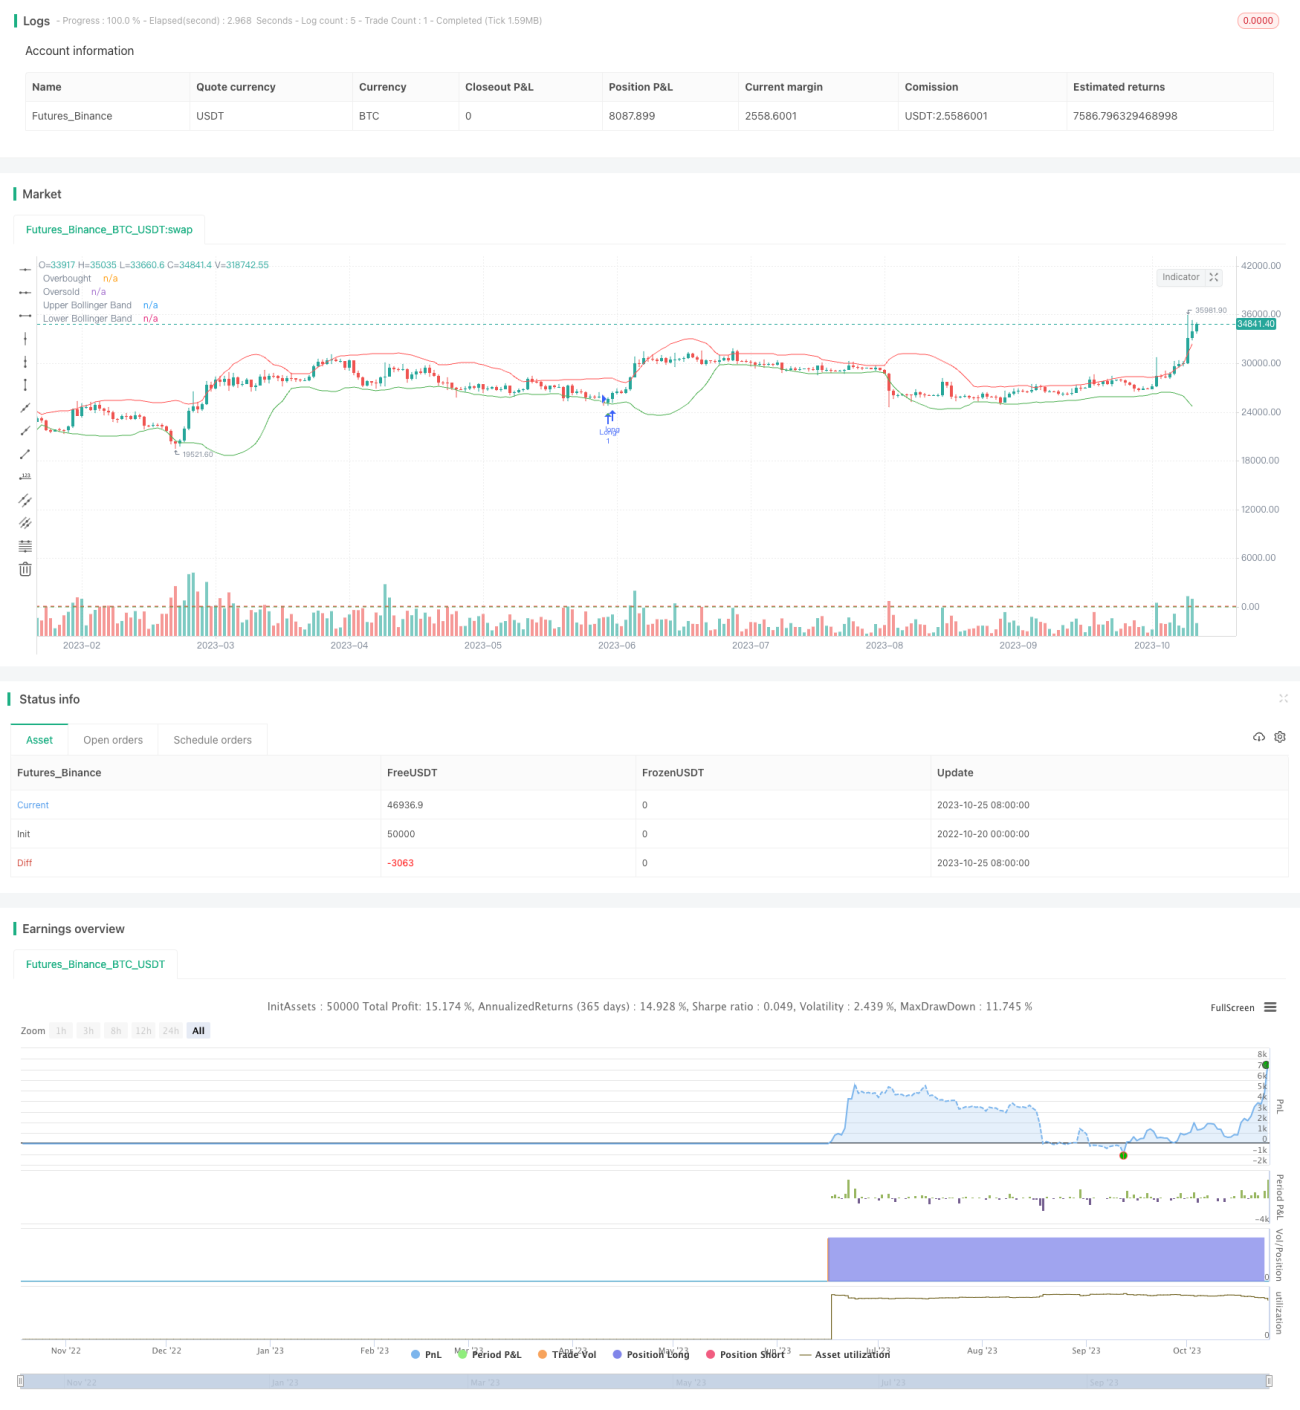
The reversal breakout strategy utilizes Bollinger Bands and Stochastic Oscillator to identify potential reversal points when an asset is overbought or oversold. It is suitable for intraday traders to capitalize on small price fluctuations for profits. The main idea is to look for trading opportunities when the price breaks out of the Bollinger Bands and Stochastic shows overbought/oversold signals.
Strategy Logic
The strategy uses both Bollinger Bands and Stochastic as the main technical indicators. Bollinger Bands are plotted at standard deviation levels above and below a simple moving average. Prices reaching the upper band are considered overbought while lower band oversold. Stochastic Oscillator determines if prices have moved too far and are due for a reversal. Readings above 80 suggest overbought conditions while below 20 oversold.
The trading rules are: go long when price breaks below the lower Bollinger band and Stochastic is below 20; go short when price breaks above the upper band and Stochastic is above 80. The stop loss is placed a few pips below the low (for longs) or above the high (for shorts). Take profit target is set at average price swing beyond recent bars.
The crossovers identify the band breakouts. Shape markers plot the entry signals. Stops and profit targets are defined after entry.
Advantages
Combining bands for support/resistance and Stochastic for overbought/oversold improves signal quality vs. a single indicator. Reversal trading after band breakouts has potential for larger gains.
The tight stop loss helps limit losses. Take profit based on average true range aims for balanced reward/risk. High frequency trading captures small moves.
Risks
Band breakouts assume mean reversion which may fail. Stochastic lags price so some moves may be missed.
Small stops restrain the profit potential. Frequent trading needs strong psychology - avoiding over-stopping.
Enhancements
Test longer Bollinger periods or confirm closes outside bands to improve quality.
Combine other indicators like MACD and KD with Stochastic for better overbought/oversold signals.
Consider dynamic stops based on volatility instead of fixed pips.
Conclusion
The strategy seeks to identify reversals by combining Bollinger Bands for support/resistance and Stochastic for overbought/oversold conditions. Fine tuning parameters, controlling risk, and ongoing optimization are key for real-world performance. Transaction costs should be considered. Past performance is no guarantee of future results.
- 1