A Powerful System Combining Reversal and Trend-Following Strategies

Overview
The Double Dip Reversal Breakout System combines elements of reversal and trend-following strategies in quantitative trading. It generates buy signals by detecting consecutive down days compared to previous closing prices, and sell signals when the price crosses above the T3 moving average line, allowing for profitable trades while managing risks.
How It Works
The system consists of two components:
- The 123 Reversal
It observes the closing price changes over past N days. If today's close is higher than yesterday's, and yesterday is lower than the day before, it signals two consecutive down days and triggers a buy signal. It also uses the STOCH indicator - when today's STOCH fast line is lower than the slow line, it further confirms the validity of the buy signal.
- The T3 Moving Average
The T3 line is calculated based on exponential moving averages using a special formula. By adjusting parameters, it controls the moving average's sensitivity to price changes. A sell signal is generated when the price crosses above the T3 line.
The system combines the two signals above, generating actual trading signals only when the 123 Reversal buy signal and T3 Sell signal occur together.
Advantage Analysis
- Effective for bottom-fishing reversal trades and riding counter-trend bounces
- The moving average helps lock in profits and manage risks
- The dual-signal mechanism improves signal validity and reduces false signals
- Combines the strengths of both trend-following and reversal strategies
- Adjustable parameters allow flexibility for different market conditions
Risk Analysis
- Reversal signals may be false, leading to losing trades
- Improper parameter tuning may cause over-trading, increasing costs
- Sell signals from moving average may prematurely exit profitable trends
- Risks like stop-loss hunting remain during volatile markets
- Parameters need to be optimized for different instruments
To address the risks, the following can be done:
- Adjust reversal parameters to improve signal validity
- Tune moving average parameters to extend holding period
- Add stop-loss to limit losses
- Optimize parameters separately for different instruments
Enhancement Opportunities
The strategy can be improved in several aspects:
-
Add filters to ensure signal validity
Additional indicators like volume breakouts can be added as filters to avoid false trades.
-
Adjust parameters for changing markets
Backtest various parameter combinations and select the set giving highest returns. Dynamic parameter tuning can also be used.
-
Incorporate machine learning for adaptive optimization
Collect large historical datasets, train ML models to forecast optimal entry/exit points, and dynamically optimize parameters.
-
Optimize parameters separately for different instruments
Instruments have different characteristics, so their optimal parameters also differ. Backtest and tune parameters independently for each.
Conclusion
The Double Dip Reversal Breakout System synergistically combines trend-following and reversal trading. It allows buying at lows after dips and securing profits from trends using moving average. The effective combination of reversal and trend signals capitalizes on reversal opportunities while locking in profits. Despite some risks, the strategy can be improved via parameter optimization, adding filters etc. to suit different market conditions. It provides effective insights for quantitative trading and merits further enhancement.
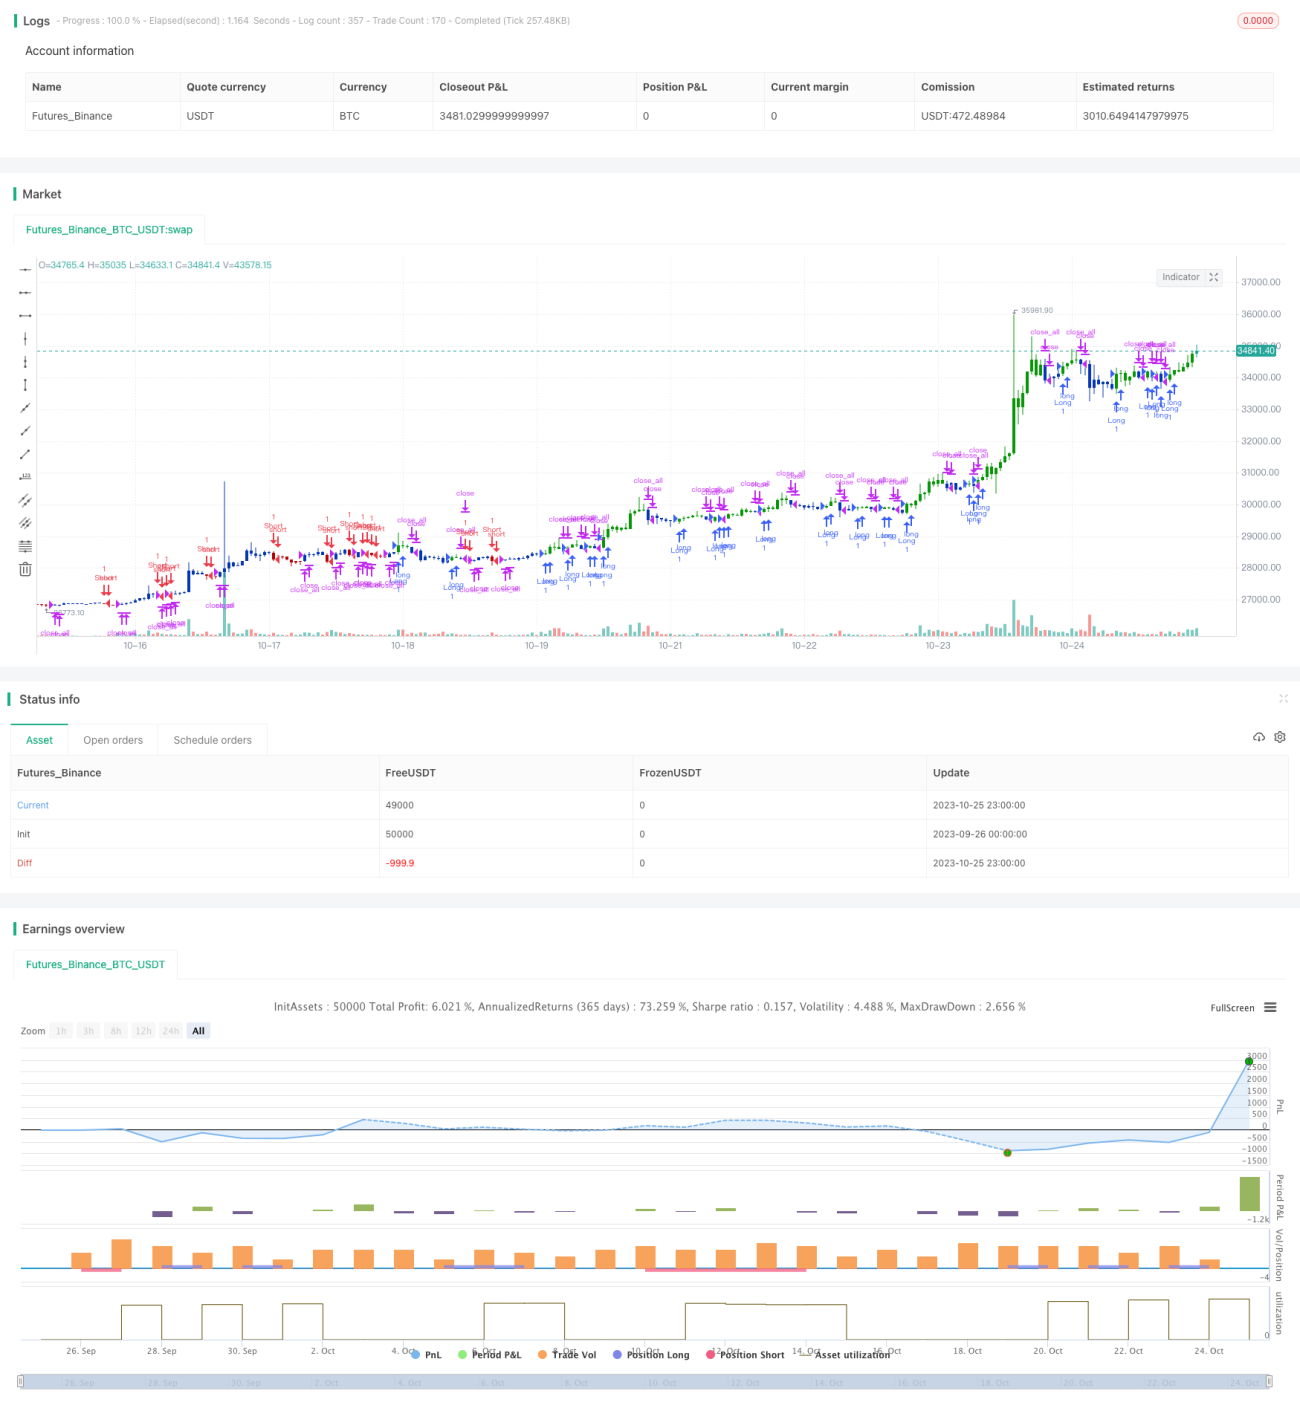
/*backtest
start: 2023-09-26 00:00:00
end: 2023-10-26 00:00:00
period: 1h
basePeriod: 15m
exchanges: [{"eid":"Futures_Binance","currency":"BTC_USDT"}]
*/

//@version=4
////////////////////////////////////////////////////////////
//  Copyright by HPotter v1.0 16/09/2021
// This is combo strategies for get a cumulative signal. - 1