Bollinger Breakout Stop-loss Strategy

Overview
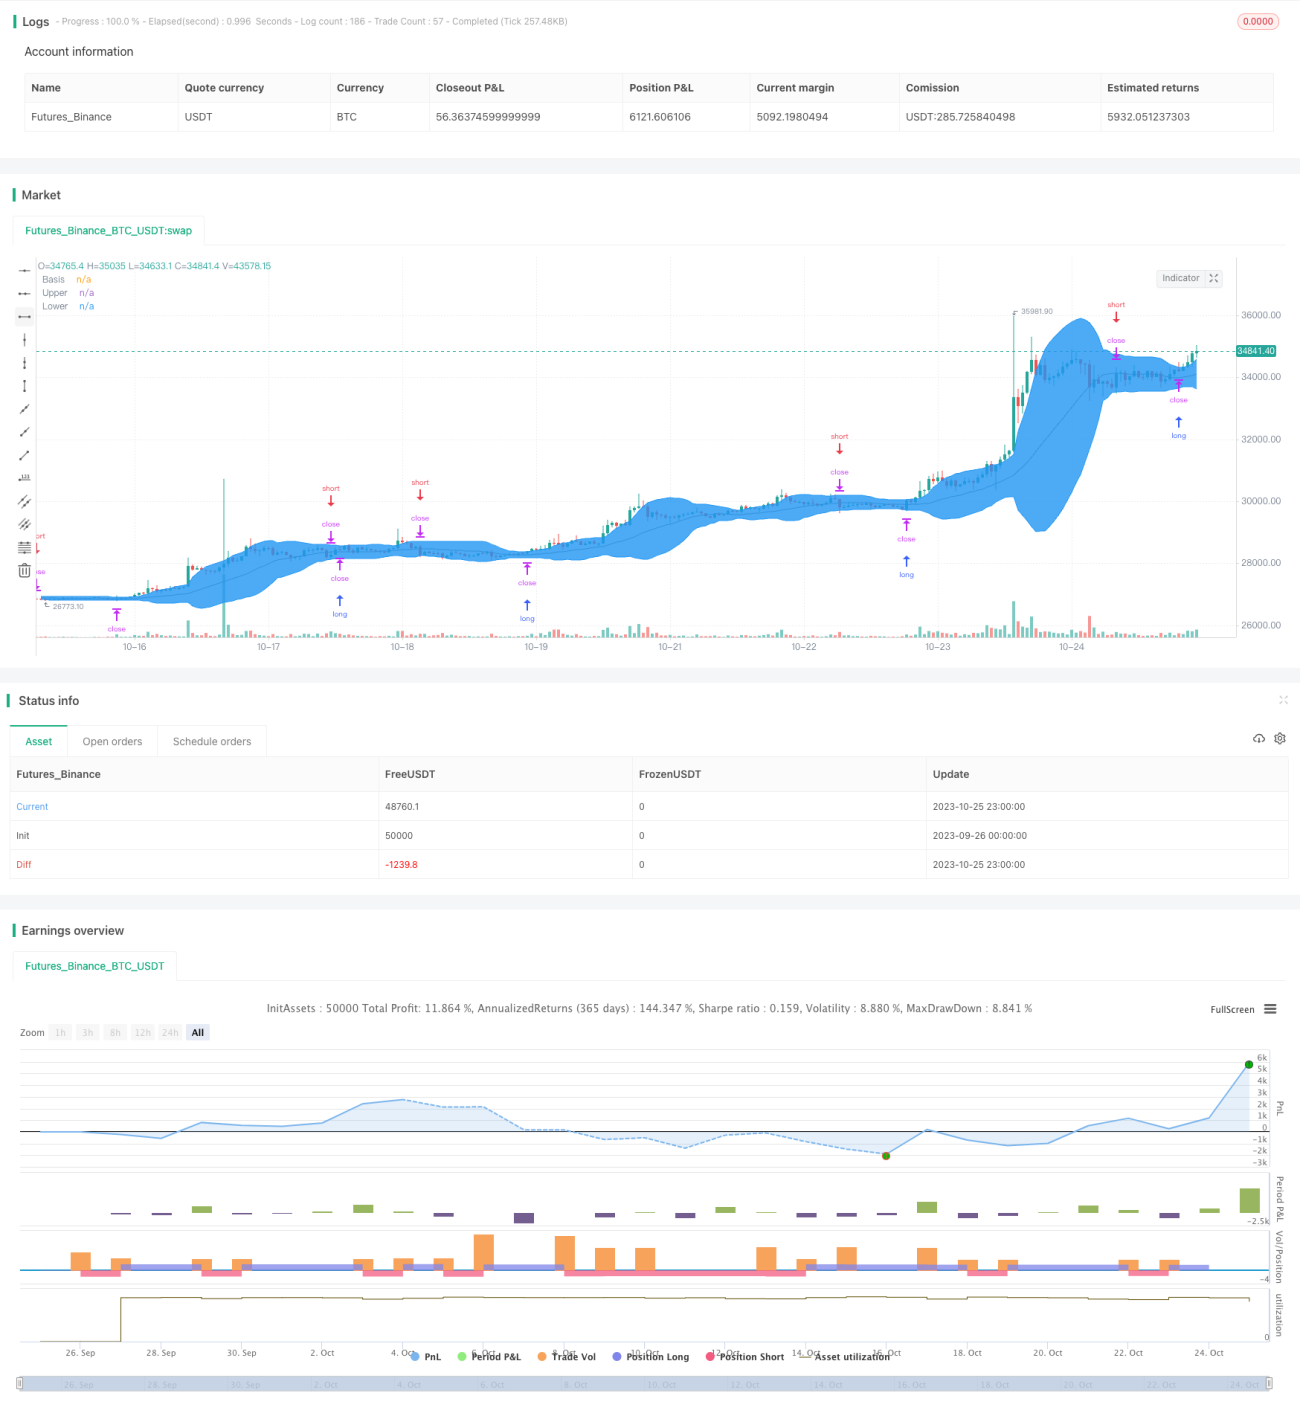
This strategy generates trading signals based on the Bollinger Bands indicator and manages positions using stop-loss/take-profit. It monitors the breakout of the Bollinger Bands upper and lower bands, goes long when price breaks above the upper band, goes short when price breaks the lower band, and exits when price breaks the bands in reverse using stop-loss orders.
Strategy Logic
The strategy utilizes the middle, upper and lower bands from the Bollinger Bands indicator. The middle band is the moving average, the upper band is middle band plus 2 standard deviations, and the lower band is the middle band minus 2 standard deviations.
First it calculates the Bollinger Bands middle, upper and lower bands. Then it checks if price breaks above the upper band or below the lower band. If price breaks above upper band, it goes long. If price breaks below lower band, it goes short. Also if price breaks the bands in reverse, it exits positions using stop-loss orders.
Specifically, the strategy logic is:
- Calculate Bollinger Bands middle, upper and lower bands
- If price breaks above upper band, go long
- If price breaks below lower band, go short
- If already long, close long when price breaks below lower band
- If already short, close short when price breaks above upper band
This allows catching trends when price makes big moves, while limiting losses using stop-loss.
Advantages
- Using Bollinger Bands for entry signals catches trends after breakouts
- Clear long/short signals, simple rules
- Stop-loss strategy limits max loss per trade
- Parameter tunability to optimize strategy
Risks
- Frequent small stop-loss trades may hurt overall P/L
- Poor parameter tuning may cause too many signals or missed trades
- Only considers price, no other indicators for confirmation
- No adjustment of stop-loss near breakout may increase loss
Can optimize via combining indicators, adjusting stop-loss units etc.
Enhancement Opportunities
- Combine other indicators like volume, moving averages to confirm signals
- Optimize Bollinger parameters for different markets
- Adjust stop-loss distance near breakout to avoid oversensitivity
- Trade only after trends develop, like Turtle Trading rules
- Auto-optimize parameters via machine learning algorithms
Conclusion
This is a relatively simple trend following strategy based on Bollinger Bands. It can quickly take positions when price breaks out and uses stop-loss to control risk. But relying solely on price may cause misjudgements, while sensitive stop-loss may increase trade frequency. We can further improve it via parameter tuning, combining indicators, adjusting stops etc. Overall it provides a simple and reliable quant trading framework.
- 1