Intraday Stochastic Oscillator with Double Moving Average Crossover Strategy

Overview
This strategy combines double moving average crossover and Stochastic oscillator to identify trend reversal opportunities for efficient short-term trading. It goes short when price enters the overbought region and goes long when price enters the oversold region, in order to catch the reversal of medium-term trends.
Strategy Logic
The strategy is based on the combination of double moving average crossover and Stochastic oscillator.
The double moving average crossover consists of a fast moving average, slow moving average and ultraslow moving average. When the fast MA crosses above the slow MA, it is a buy signal. When the fast MA crosses below the slow MA, it is a sell signal. The double MA crossover can identify medium-term trend reversal points.
The Stochastic oscillator contains the %K and %D values. %K shows where the current close is relative to the highest and lowest prices of the past N days. %D is the M-day simple moving average of %K. Values above 80 mean overbought levels and values below 20 mean oversold levels. The Stochastic oscillator can identify short-term overbought/oversold zones.
This strategy combines the double MA crossover and Stochastic oscillator. It looks for trend reversal signals from the double MA crossover when Stochastic shows overbought/oversold levels. This aims to catch short-term trend reversals.
Advantage Analysis
The advantages of this strategy:
-
Combining double MA crossover and Stochastic oscillator to identify both medium-term and short-term trend reversals.
-
Using Stochastic overbought/oversold signals to select more effective double MA crossover reversal trades.
-
Clear trading rules easy to implement.
-
Adjustable trading time and month parameters suitable for different products and time periods.
-
Stop loss to control risks.
Risk Analysis
The risks of this strategy:
-
Double MA may have false breakouts. Stochastic may have invalid bull/bear divergences, leading to wrong trade signals. Fine tune parameters or add other indicators for combo confirmation.
-
Based solely on technical indicators without considering fundamentals. May fail on major economic events. Add economic event risk control.
-
Hard to pinpoint exact MA reversal timing, may have issues of stops being too tight or too wide. Optimize stop loss strategy.
-
Improper parameter settings may lead to over-trading or poor signal quality. Optimize parameters for different products and timeframes through backtesting.
-
Only suitable for short-term trading, not long-term holding. Control position sizing.
Optimization Directions
The strategy can be optimized in several aspects:
-
Test more indicator combos like KDJ, MACD etc to improve signal validity.
-
Add trading volume analysis to avoid false breakouts.
-
Optimize double MA parameters to identify more accurate reversal points.
-
Optimize stop loss strategy to reduce chance of being stopped out.
-
Add economic event risk control modules to avoid impacts from major events.
-
Use machine learning techniques to auto optimize parameters for better adaptiveness.
-
Backtest on more products and timeframes to find best applications.
Conclusion
This strategy trades at medium-term trend reversal points identified by the double MA crossover and Stochastic bull/bear divergences. Compared to using a single indicator, it can improve trade profitability with clear rules. But it also has risks that require parameter and stop loss optimization, and more filters and risk controls. Overall it is a reliable, medium-frequency short-term trading strategy.
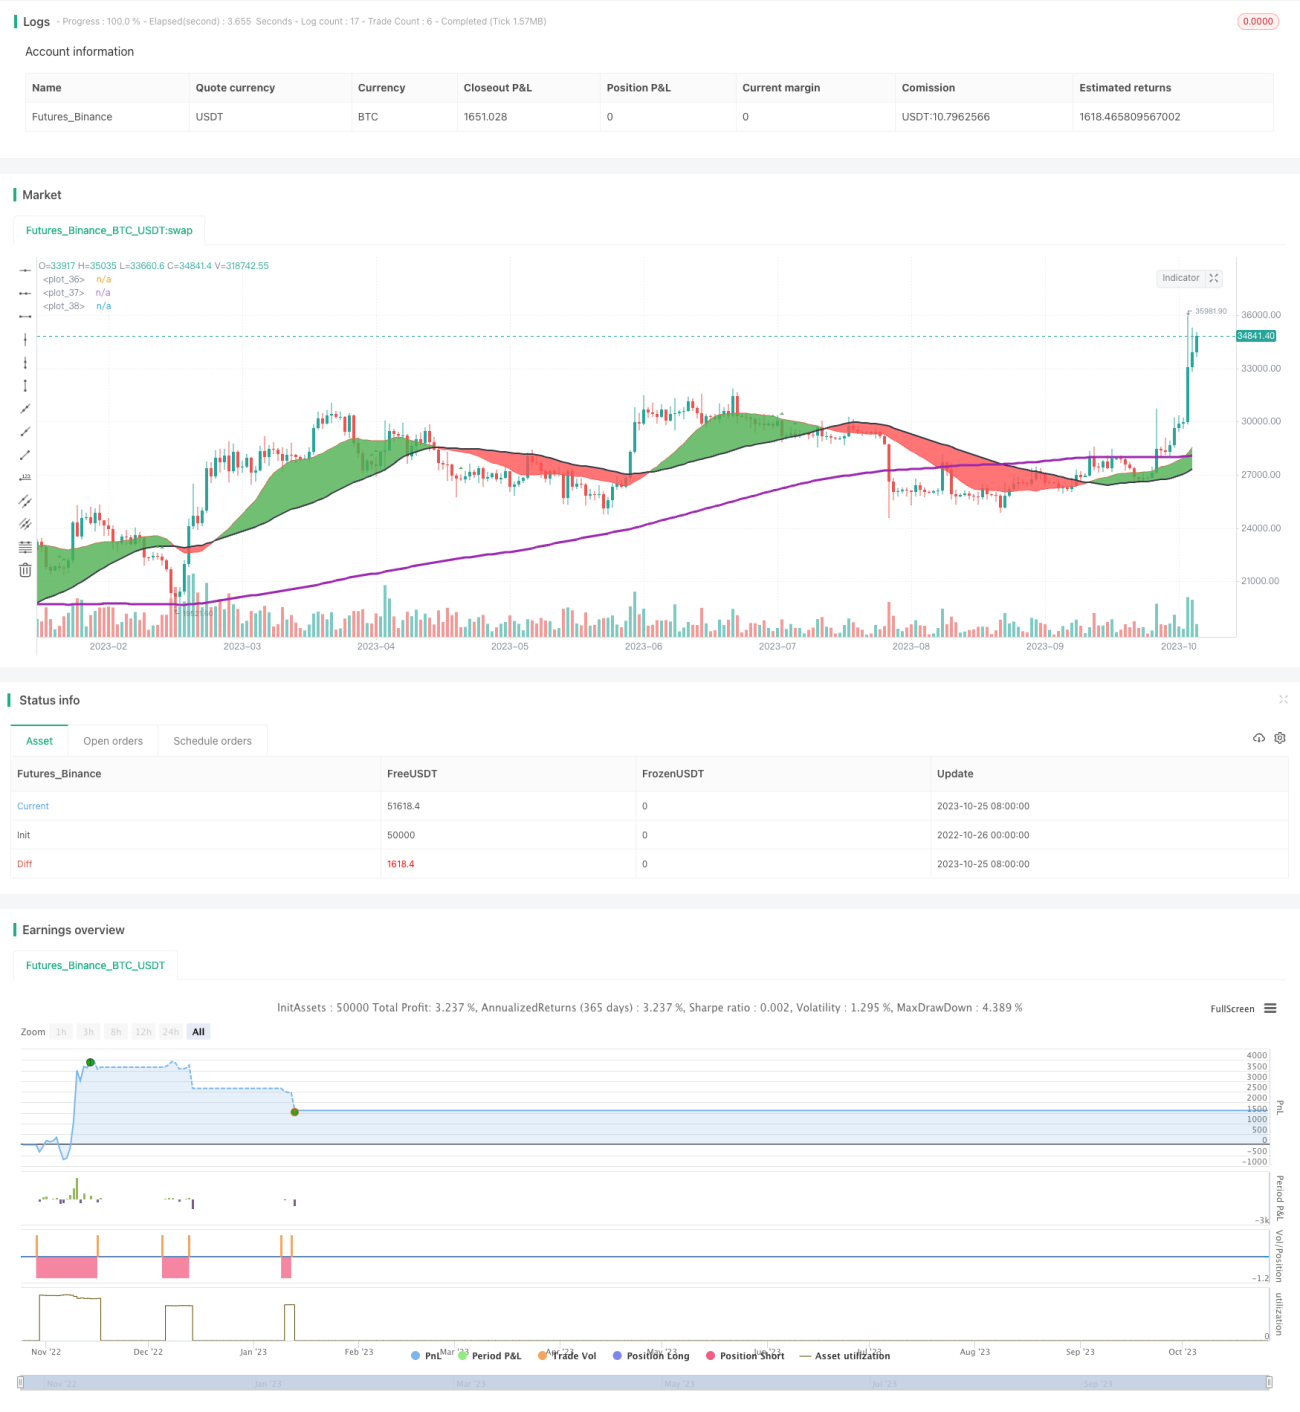
/*backtest
start: 2022-10-26 00:00:00
end: 2023-10-26 00:00:00
period: 1d
basePeriod: 1h
exchanges: [{"eid":"Futures_Binance","currency":"BTC_USDT"}]
*/

//@version=3
strategy(title="Intraday Stochiastic Strategy", shorttitle="Intraday Stochiastic Strategy", overlay=true, initial_capital = 1000)
//WORKS FOR BTCUSD M30
//OBVERVED GOOD PERFORMANCES FOR SELL MODE M15 : US30USD / UK100GBP / JP225USD / SPX500USD / BCOUSD / EURGBP- 1