Multi-Indicator Bitcoin Daily Trading Strategy

Overview
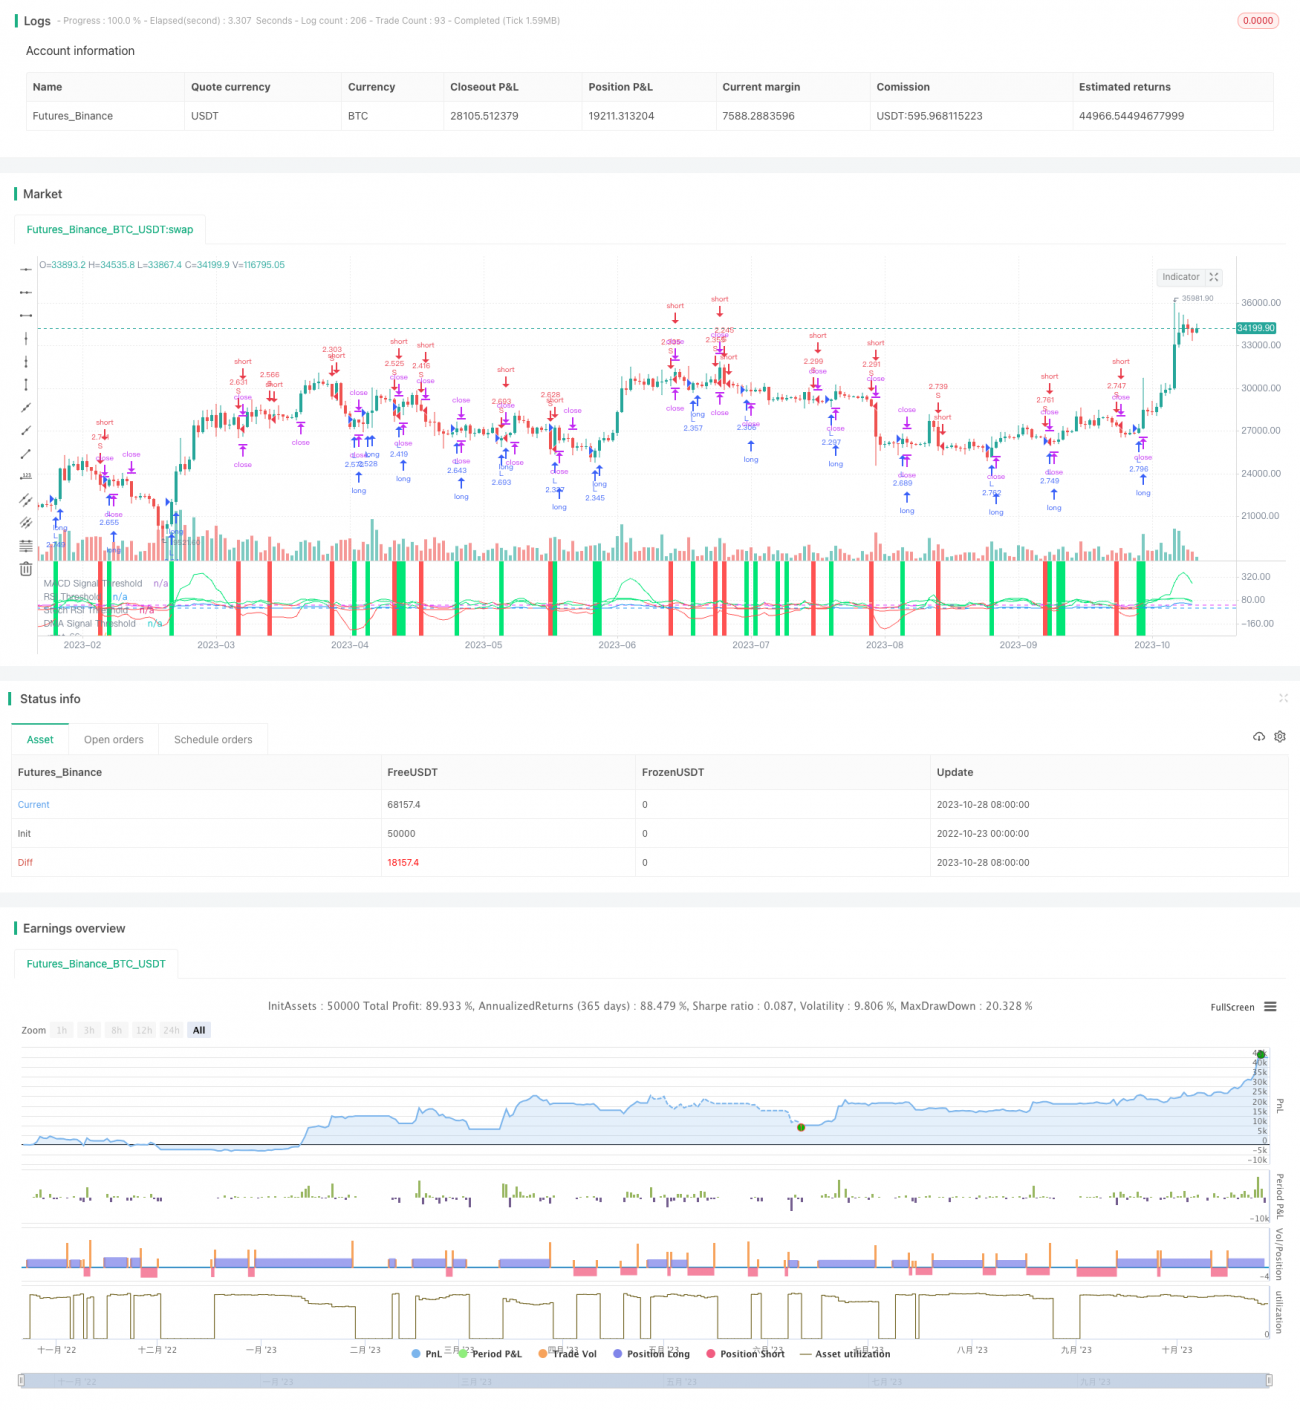
This strategy combines multiple indicators to identify trading opportunities within the daily time frame for Bitcoin. It mainly uses indicators like MACD, RSI, Stoch RSI, together with the direction of moving average to determine the current trend direction for generating buy and sell signals.
Strategy Logic
The strategy utilizes the following key indicators:
-
MACD (Fast MA - Slow MA) and its signal line. MACD crossing above signal line gives buy signal, and crossing below 0 gives sell signal.
-
RSI (Relative Strength Index). RSI crossing above a threshold gives buy signal.
-
Stoch RSI. Stoch RSI shows overbought/oversold levels of RSI. Stoch RSI below threshold gives buy signal, while above threshold gives sell signal.
-
Moving average direction. Close price crossing below MA gives sell signal.
According to these indicators, the trading signals are:
Buy Signal: When (Stoch RSI < Threshold) AND (MACD crossing above threshold OR RSI crossing above threshold)
Sell Signal: When (MACD crossing below 0) AND (Close below MA OR Stoch RSI > Threshold)
Using multiple indicators together can better determine the current trend direction and identify trend reversal points for entering trades.
Advantages
-
Combining multiple indicators improves accuracy and avoids false signals from a single indicator.
-
MACD shows trend direction and strength. RSI reflects overbought/oversold levels. Stoch RSI determines overbought/oversold of RSI. MA shows trend direction. These indicators verify each other.
-
The buy/sell signals require a combination of multiple indicators, filtering out some false signals and avoiding unnecessary trades.
-
Backtest starts from 2017/1/1, covering the huge bull run of Bitcoin at 2017 year end. Tests strategy performance in a real bull market.
-
Stop loss is set to control loss in single trades.
Risks
-
Although using multiple indicators improves accuracy, discrepancy between them can still lead to some wrong signals.
-
The optimized stop loss level may need adjustments for different market situations. Stop loss too wide increases loss in single trades, while too tight may get stopped out prematurely.
-
Daily timeframe prevents detailed operations in shorter time ranges. Unable to respond to sudden short-term big moves.
-
Strategy is only backtested on limited historical data. Overfit risk exists. Requires further testing across longer timeframe and more markets.
Enhancement Opportunities
-
Test more indicator combinations to find optimal multi-indicator strategies.
-
Optimize parameters of the indicators for better values.
-
Test different stop loss levels to find optimal risk/reward ratio.
-
Conduct backtests across longer historical data to avoid overfitting.
-
Explore applying strategy logic in higher frequency timeframes for more frequent trading.
Conclusion
This strategy combines MACD, RSI, Stoch RSI and other indicators to determine the bitcoin daily trend direction and identify trend reversals for trade entry. Stop loss is set to control trade risk. Backtest shows positive results but still requires further verification across longer timeframe and more markets to avoid overfit risks. Further optimizations on indicator parameters and stop loss/take profit levels can improve results. The strategy provides an initial idea of multi-indicator combination approach which is worth deeper exploration and enhancement.
/*backtest
start: 2022-10-23 00:00:00
end: 2023-10-29 00:00:00
period: 1d
basePeriod: 1h
exchanges: [{"eid":"Futures_Binance","currency":"BTC_USDT"}]
*/

//@version=4
// Original code is from CredibleHulk and modified by bennef
strategy("BTC Daily Strategy BF", overlay=false, initial_capital=10000, default_qty_type=strategy.percent_of_equity, default_qty_value=100, commission_type=strategy.commission.percent, commission_value=0.075)
- 1