Volume Difference Delta Cycle Oscillator Trading Strategy

Author: ChaoZhang, Date: 2023-10-30 11:45:42
Tags:

img

Overview

This strategy judges the conversion of bull and bear cycles by calculating the rate of change of volume change, which belongs to volume-price divergence strategies. It combines the momentum indicator of volume and Bollinger Bands of price to determine the leading effect of volume change on price and capture turning points of trends.

Trading Logic

  1. Calculate the rate of change of volume change (the rate of change of Volume Difference Indicator), to get the volume momentum based indicator nresult.

  2. Calculate Bollinger Bands of nresult to get bbr representing the standard deviation of volume momentum.

  3. Calculate Bollinger Bands of close price to get bbr1 representing the standard deviation of price.

  4. Calculate the difference hist between the two, which is the standard deviation of volume momentum minus the standard deviation of price, as the final indicator.

  5. When hist crosses above 0, it is the short entry signal, and when crossing below 0, it is the long entry signal.

By calculating the rate of change of volume change, the leading effect of volume change on price is amplified. When volume reverses while price has not reversed yet, hist will cross above or below 0, generating trading signals. It can predict the turning points of price trends in advance.

Advantages

  1. This strategy is a volume-price divergence strategy based on the rate of change of volume, which can reflect the turning points of price trends in advance.

  2. Calculating the rate of change of volume change amplifies the leading effect of volume change on price, resulting in better trading performance.

  3. Combining volume momentum indicators with Bollinger Bands of price makes trading signals more reliable.

  4. Using triple exponential smoothing on Hist data makes signals more accurate and smooth.

  5. Setting overbought/oversold lines and long/short stop loss/take profit orders helps control risks effectively.

  6. Many customizable parameters like Bollinger Bands length, standard deviation multiplier and Hist smoothing factors enable strategy optimization.

Risks

  1. Volume data may not truly reflect market trading and could be manipulated.

  2. Volume-price divergence may not persist, and price may breakout without reversing.

  3. Improper parameter settings may cause over-trading or inaccurate signals.

  4. Beware of false signals from abnormal volume data.

  5. Reversal signals should be avoided when the trend is strong.

Risks can be mitigated by optimizing parameters, adding other filters, and setting stop loss/take profit.

Enhancement Opportunities

  1. Optimize Bollinger Bands parameters for more stable signals.

  2. Add trend filter to avoid trading against the trend.

  3. Incorporate other indicators like MACD for signal confirmation.

  4. Utilize AI to auto-optimize parameters adaptively.

  5. Add dynamic stop loss/take profit to optimize risk management.

  6. Apply machine learning to determine volume-price divergence success rate for higher signal quality.

Conclusion

This strategy amplifies the leading effect of volume change on price by calculating the rate of change of volume change, enabling early detection of trend turning points. Compared to single volume indicators, it has higher reliability and accuracy. But risks like volume manipulation and divergence breakout should be guarded against via parameter optimization, indicator filters etc. In the future, AI can be leveraged for adaptive parameter optimization to further improve strategy stability and profitability.
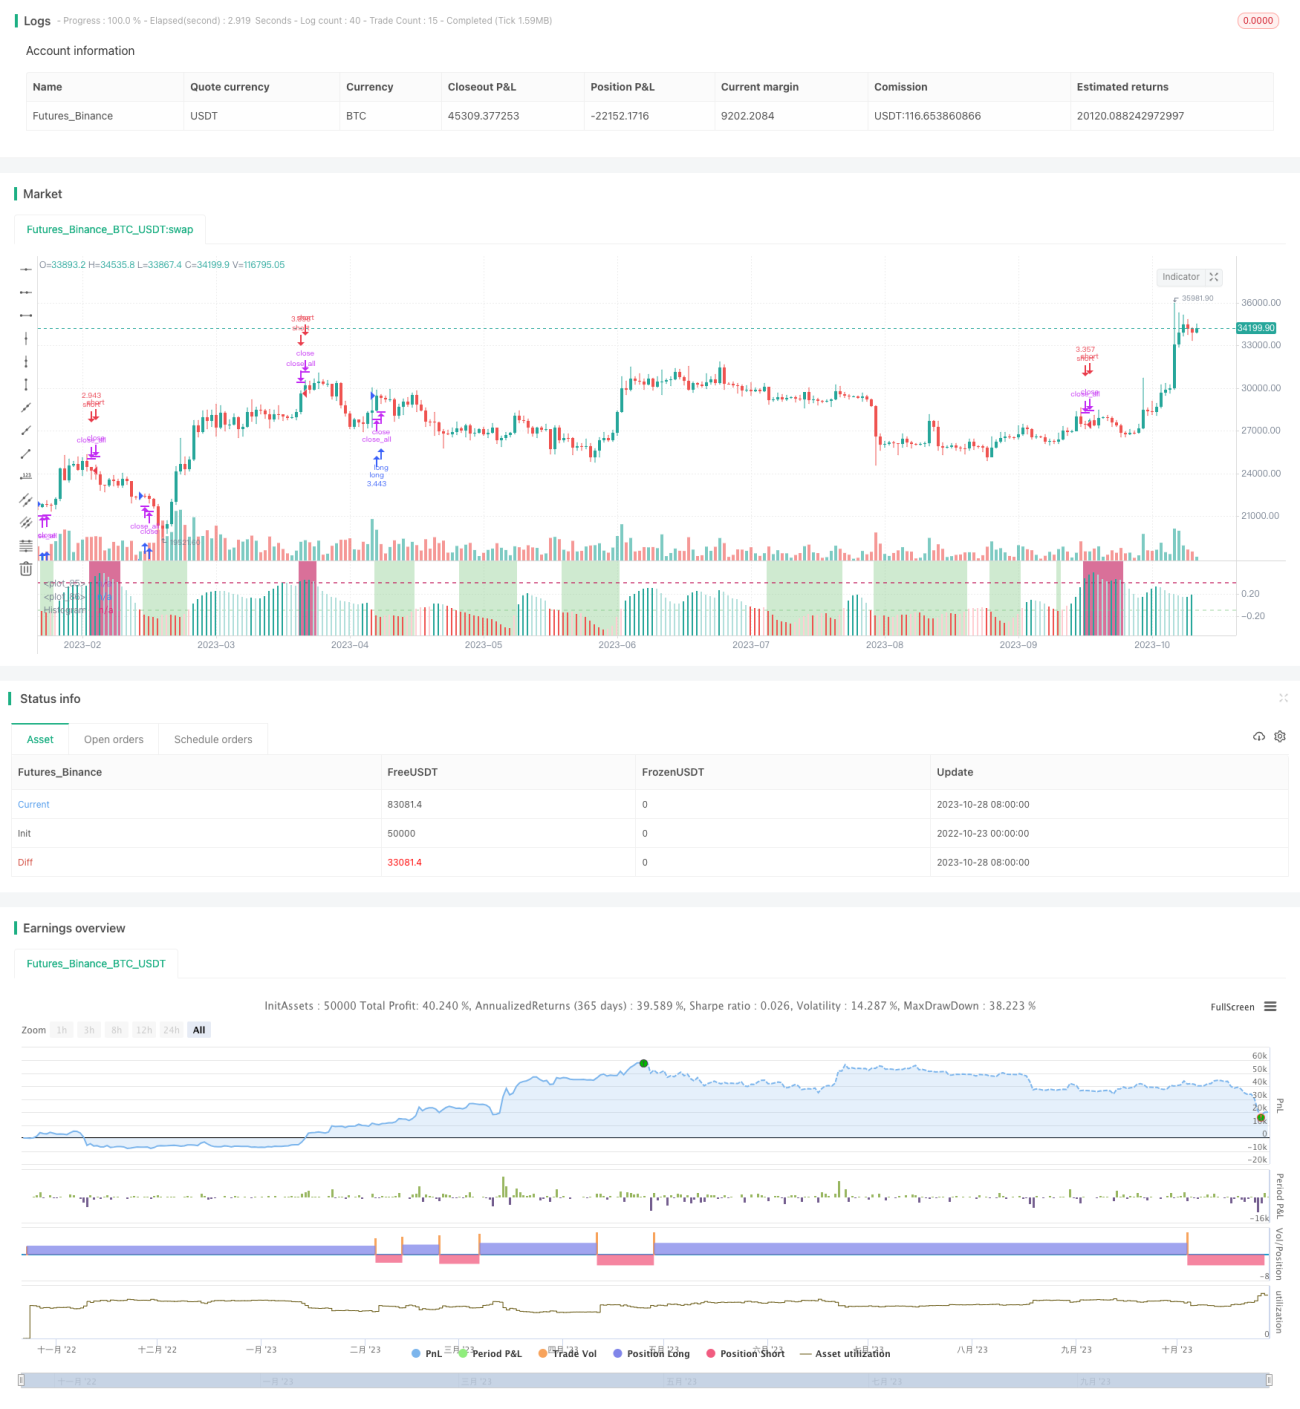

/*backtest
start: 2022-10-23 00:00:00
end: 2023-10-29 00:00:00
period: 1d
basePeriod: 1h
exchanges: [{"eid":"Futures_Binance","currency":"BTC_USDT"}]
*/

//// This source code is subject to the terms of the Mozilla Public License 2.0 at https://mozilla.org/MPL/2.0/
// © tathal and special thanks to oakwhiz for his porting of my custom volume indicator

//@version=5
strategy('Volume Difference Delta Cycle Oscillator', 'VDDC Osc', default_qty_type=strategy.percent_of_equity, default_qty_value=100, max_bars_back=5000)

startDate = input.int(title='Start Date', defval=1, minval=1, maxval=31)
startMonth = input.int(title='Start Month', defval=1, minval=1, maxval=12)
startYear = input.int(title='Start Year', defval=2010, minval=1800, maxval=2100)

endDate = input.int(title='End Date', defval=31, minval=1, maxval=31)
endMonth = input.int(title='End Month', defval=12, minval=1, maxval=12)
endYear = input.int(title='End Year', defval=2021, minval=1800, maxval=2100)

// Normalize Function
normalize(_src, _min, _max) =>
    // Normalizes series with unknown min/max using historical min/max.
    // _src      : series to rescale.
    // _min, _min: min/max values of rescaled series.
    var _historicMin = 10e10
    var _historicMax = -10e10
    _historicMin := math.min(nz(_src, _historicMin), _historicMin)
    _historicMax := math.max(nz(_src, _historicMax), _historicMax)
    _min + (_max - _min) * (_src - _historicMin) / math.max(_historicMax - _historicMin, 10e-10)


// STEP 2:
// Look if the close time of the current bar
// falls inside the date range
inDateRange = true

// Stop loss & Take Profit Section     
l_sl_inp = input(2.0, title='Long Stop Loss %') / 100
l_tp_inp = input(4.0, title='Long Take Profit %') / 100

l_stop_level = strategy.position_avg_price * (1 - l_sl_inp)
l_take_level = strategy.position_avg_price * (1 + l_tp_inp)

s_sl_inp = input(2.0, title='Short Stop Loss %') / 100
s_tp_inp = input(4.0, title='Short Take Profit %') / 100

s_stop_level = strategy.position_avg_price * (1 + s_sl_inp)
s_take_level = strategy.position_avg_price * (1 - s_tp_inp)

src = close

//  Volume Differnce Indicator Delta

float change_src = ta.change(src)
float i_obv = ta.cum(change_src > 0 ? volume : change_src < 0 ? -volume : 0 * volume)
float i_pvt = ta.pvt

float result = ta.change(i_obv - i_pvt)

float nresult = ta.ema(normalize(result, -1, 1), 20)


// Volume Differnce Indicator Delta %B
length = input.int(20, minval=1, title='Volume Bands Length')
mult = input.float(2.0, minval=0.001, maxval=50, title='Volume Bands StdDev')
basis = ta.ema(nresult, length)
dev = mult * ta.stdev(nresult, length)
upper = basis + dev
lower = basis - dev
bbr = (nresult - lower) / (upper - lower)

// Normal %B, Based on close

l1 = input.int(20, minval=1, title='Bollinger Bands Length')
src2 = close
mult1 = input.float(2.0, minval=0.001, maxval=50, title='Bollinger Bands StdDev')
basis1 = ta.sma(src2, l1)
dev1 = mult1 * ta.stdev(src2, l1)
upper1 = basis1 + dev1
lower1 = basis1 - dev1
bbr1 = (src - lower1) / (upper1 - lower1)

/// Final Output Line

hist = ta.ema(ta.ema(ta.ema(bbr1 - bbr, input(2, title='Hist Smoothing Factor #1')), input(2, title='Hist Smoothing Factor #2')), input(2, title='Hist Smoothing Factor #3'))

/// Overbought / Oversold Line Creation
oversold = input(-.1)
overbought = input(.4)
hline(oversold, linewidth=2, color=color.new(#81c784, 62))
hline(overbought, linewidth=2, color=color.new(#c2185b, 38))

/// Long & Short Conditions

short = hist > overbought
long = hist < oversold

/// Colors & Plotting
histColor = hist >= 0 ? hist[1] < hist ? #26A69A : #B2DFDB : hist[1] < hist ? #FFCDD2 : #EF5350
plot(hist, title='Histogram', style=plot.style_columns, color=color.new(histColor, 0))

CrossBgColor = long ? color.new(#81c784, 62) : short ? color.new(#c2185b, 38) : na
bgcolor(color.new(CrossBgColor, 90))

/// Strategy Methodology

if inDateRange
    strategy.entry('long', strategy.long, when=long, stop=l_stop_level, limit=l_take_level)

if inDateRange and strategy.position_size > 0
    strategy.close_all(when=short)

if inDateRange
    strategy.entry('short', strategy.short, when=short, stop=s_stop_level, limit=s_take_level)

if inDateRange and strategy.position_size < 0
    strategy.close_all(when=long)


More