Low Point Rebound Strategy

[trans]
概述
反转低点反弹策略是一种简单有效的股票交易策略。它通过捕捉低点反弹机会,在股价反转上涨时进入市场,采用短期操作,获利后快速止损退出。
策略原理
该策略主要基于两个指标:确定入场时机的5日最低价以及确定退出时机的2日RSI。
具体操作流程如下:
-
如果当日收盘价低于昨日的5日最低价,那么在收盘时做多入场。
-
如果2日RSI在超买区(默认为50)之上收盘,那么在当日收盘时平仓止盈。
-
如果入场后5天内没有触发止盈条件,强制止损退出。
这样,我们就在股价处于反转上涨的关键点附近入场做多,通过RSI的超买信号来锁定利润,同时设置了时限止损来控制风险。
优势分析
这种策略具有以下优势:
-
操作简单,容易实施。仅需要观察两个指标,规则清晰,可以快速做出交易决策。
-
采用趋势反转思路,在股价反转上涨前进入,捕捉较大行情。
-
设置止盈止损点位,可以控制单次损失,实现稳定盈利。
-
资金周转快,不需要长时间等待,可以重复进行多次交易。
-
可广泛适用于大多数股票,特别是具有明显短期低价反转特征的股票。
风险分析
该策略也存在一些风险:
-
选错反转时间,可能导致亏损。判断反转时间需要实际经验。
-
止损点设置不当,可能扩大损失。应考虑合理的止损幅度。
-
行情震荡,止盈点难以触发。可适当调整RSI参数。
-
仅适合短线操作,不适合长期持有。
-
高换手频率增加交易成本和滑点成本。
优化方向
可以从以下几个方面进一步优化该策略:
-
结合趋势指标,避免逆势操作。例如MACD,KDJ等。
-
测试不同天数最低价的参数,找到更合适的反转确认指标。
-
测试RSI的参数大小,优化止盈条件。
-
考虑加入止损优化模块,通过ATR动态设置止损点。
-
优化入场时机,可在反转确认后等待再入场,过滤假突破。
-
考虑交易成本后,设定合理的止盈目标。控制交易频率。
总结
反转低点反弹策略是一种典型的短线操作策略。它把握低点反弹的交易机会,采用简单的指标组合判断入场时机和出场时机,实现快速止盈止损。相比买入持有,这种策略具有风险收益率更高的优点。通过不断优化参数和规则,这种策略可以适应大多数股票的特征,获得稳定收益。但也需要警惕过度频繁交易造成的交易成本问题。总体来说,反转低点反弹策略是一种既简单实用又有效盈利的股市交易策略。
||
Overview
The Low Point Rebound strategy is a simple and effective stock trading strategy. It captures low point rebound opportunities and enters the market when stock prices reverse upwards. It aims to profit in the short term and exit quickly with stop loss.
Strategy Logic
This strategy mainly uses two indicators: the 5-day lowest price to determine entry timing and the 2-day RSI to determine exit timing.
The specific process is as follows:
-
If today's close is below yesterday's 5-day lowest price, go long at today's close.
-
If 2-day RSI closes above the overbought level (default 50), close long position at today's close to take profit.
-
If held for more than 5 days without meeting profit taking criteria, forced exit with stop loss.
This allows us to enter long around key points when prices reverse upwards. RSI overbought signals are used to lock in profits, while stop loss controls risk.
Advantage Analysis
This strategy has the following advantages:
-
Simple to implement. Only two indicators to monitor, clear rules for quick decisions.
-
Captures significant trends by entering before reversal upswings.
-
Stop loss and take profit points control single trade loss and achieve stable profits.
-
High capital turnover without long waiting times. Can repeat trades frequently.
-
Widely applicable to most stocks, especially those with clear short-term low price reversals.
Risk Analysis
There are also some risks to this strategy:
-
Picking wrong reversal timing may lead to losses. Identifying reversals needs experience.
-
Improper stop loss placement may magnify losses. Reasonable stop loss percentage should be considered.
-
Price whipsaws may prevent take profit from triggering. RSI parameters could be adjusted.
-
Only suitable for short-term trading, not long term holds.
-
High turnover increases transaction and slippage costs.
Improvement Directions
This strategy can be further optimized in the following aspects:
-
Add trend indicators to avoid counter trend trades. E.g. MACD, KDJ etc.
-
Test different lowest price lookback periods to find better reversal confirmation.
-
Optimize RSI parameters for better profit taking levels.
-
Consider dynamic stop loss module using ATR.
-
Improve entry timing with confirmation after reversal signal. Filter fake breakouts.
-
Set reasonable profit targets considering transaction costs. Control trade frequency.
Conclusion
The Low Point Rebound strategy is a typical short-term trading strategy. It capitalizes on low point reversal opportunities using simple indicators for entry and exit timing, enabling quick profit taking and stopping losses. Compared to buy and hold, it offers higher risk adjusted returns. With continuous parameter and rule optimization, this strategy can be adapted for most stocks to generate steady profits. But trading costs from high turnover should be monitored. Overall, the Low Point Rebound is an easy to use yet effective strategy for stock market trading.
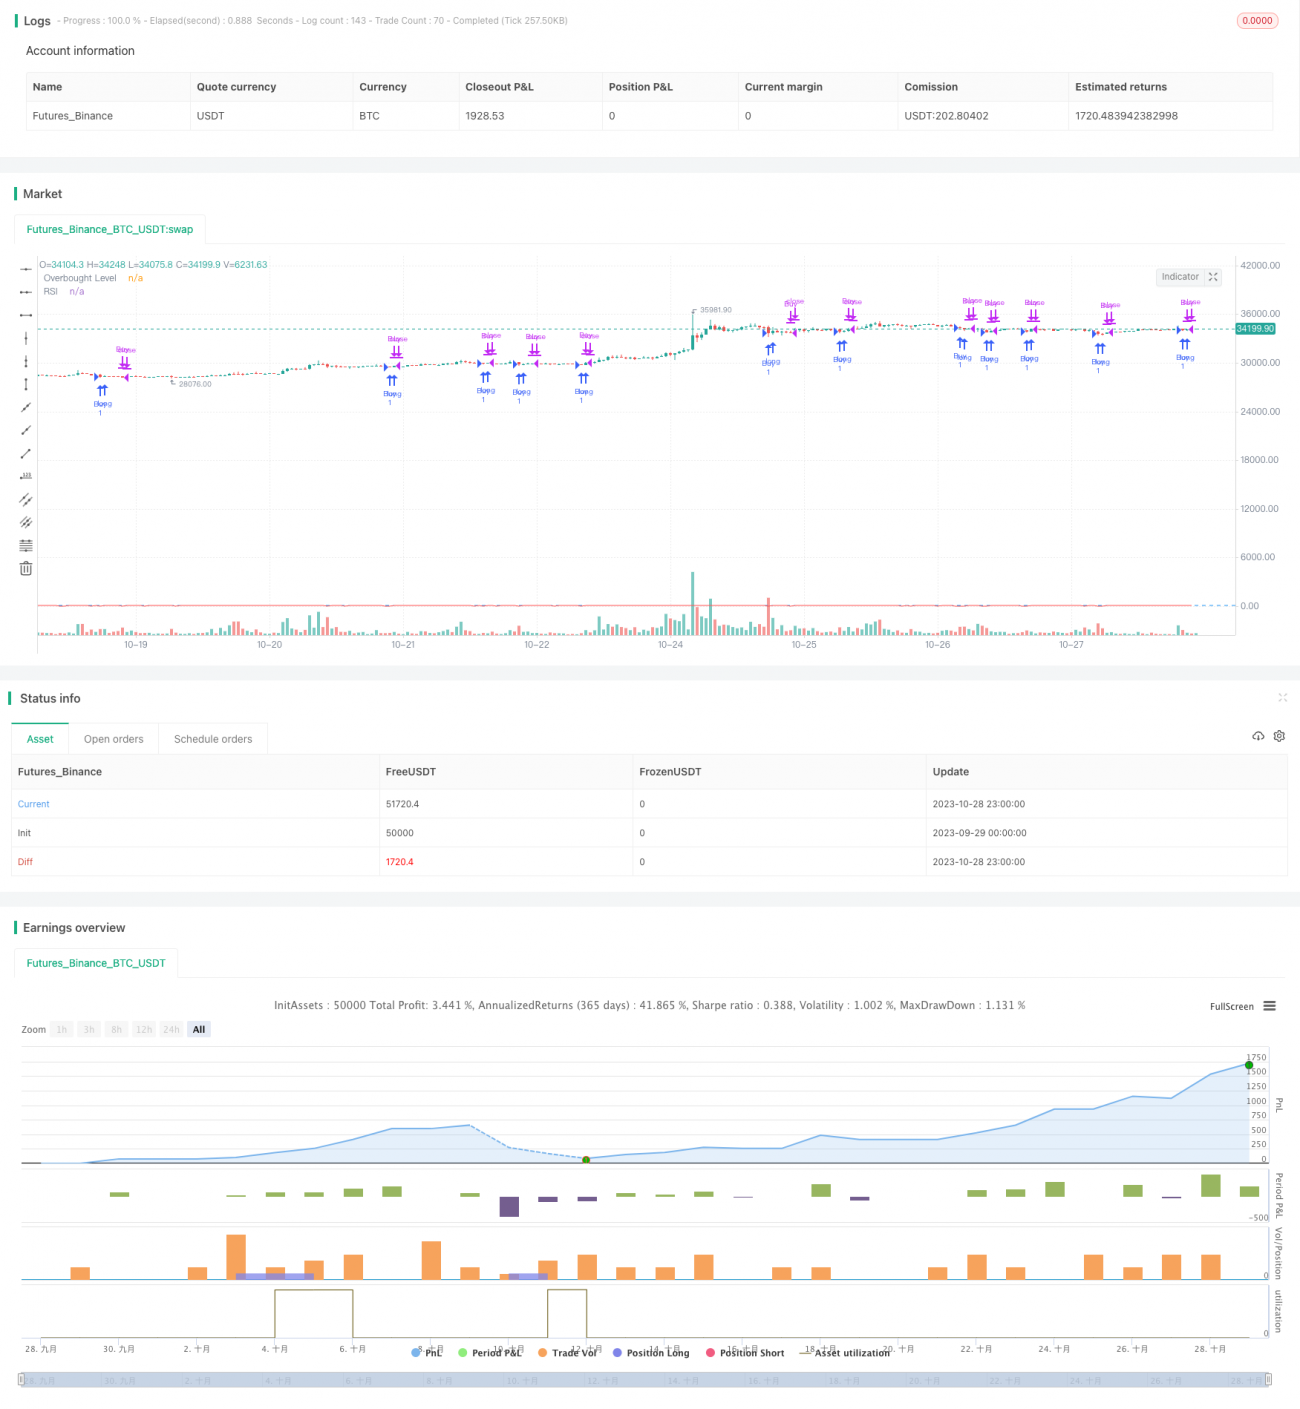
/*backtest
start: 2023-09-29 00:00:00
end: 2023-10-29 00:00:00
period: 1h
basePeriod: 15m
exchanges: [{"eid":"Futures_Binance","currency":"BTC_USDT"}]
*/

// This source code is subject to the terms of the Mozilla Public License 2.0 at https://mozilla.org/MPL/2.0/
// © hobbiecode

// If today’s close is below yesterday’s five-day low, go long at the close.- 1