Multi Timeframe Take Profit Strategy

Author: ChaoZhang, Date: 2023-10-30 12:02:43
Tags:

img

Overview

This strategy aims to implement take profit management under multiple timeframes. The strategy uses both percentage take profit and key price levels take profit based on higher timeframes, to achieve more precise and effective take profit management.

Strategy Logic

The strategy first enters long when the Wave Trend indicator crosses up.

For take profit management, the strategy uses two types of take profit:

  1. Percentage take profit: Set multiple take profit prices based on certain percentages of the entry price.

  2. Multi timeframe take profit: Draw moving averages on the daily and 4-hour charts, and use their prices as take profit prices.

For percentage take profit, the strategy sets 4 take profit prices with different percentages. When price hits each take profit price, it will close partial positions based on the set percentage.

For multi timeframe take profit, the strategy draws 100MA and 200MA on both daily and 4-hour charts. When price hits these moving averages, it will close positions.

In addition, a stop loss price is set. When price is below the stop loss price, all positions will be closed.

The whole strategy combines percentage take profit and multi timeframe take profit to achieve more comprehensive and sophisticated take profit management.

Advantages

  • Adopt percentage take profit to avoid premature or insufficient take profit based on fixed percentages.

  • Utilize multi timeframe analysis to set more precise take profit prices with better levels.

  • Multi-layered take profit allows partial closing positions and reduces risks.

  • Setting stop loss price effectively controls downside risks.

  • Combining percentage take profit and multi timeframe take profit makes take profit more comprehensive and refined.

Risks Analysis

  • Percentage take profit relies on parameter settings. Improper settings may lead to premature or late take profit.

  • Multi timeframe analysis depends on moving averages, which have some lagging. Divergence may occur.

  • Improper stop loss placement may cause unnecessary stop loss.

  • Parameters need to be optimized for the best match between percentage take profit and multi timeframe take profit.

Optimization Directions

  • Test more moving averages to find the optimal ones as key take profit prices.

  • Try model prediction methods to forecast key price levels as take profit prices.

  • Introduce more take profit rules like expected profit ratio, trailing take profit etc. to make take profit more comprehensive.

  • Test optimal percentage take profit parameters under different holding periods.

  • Optimize take profit parameters through backtesting for better overall risk-reward ratios.

Summary

This strategy realizes flexible and precise take profit management by combining percentage take profit and multi timeframe take profit. The strategy has advantages like better take profit price selection and more comprehensive take profit. It also has problems like parameter setting and stop loss placement. Follow-up improvements can be made by optimizing take profit parameters, adding more take profit rules etc., to make the take profit system more robust.
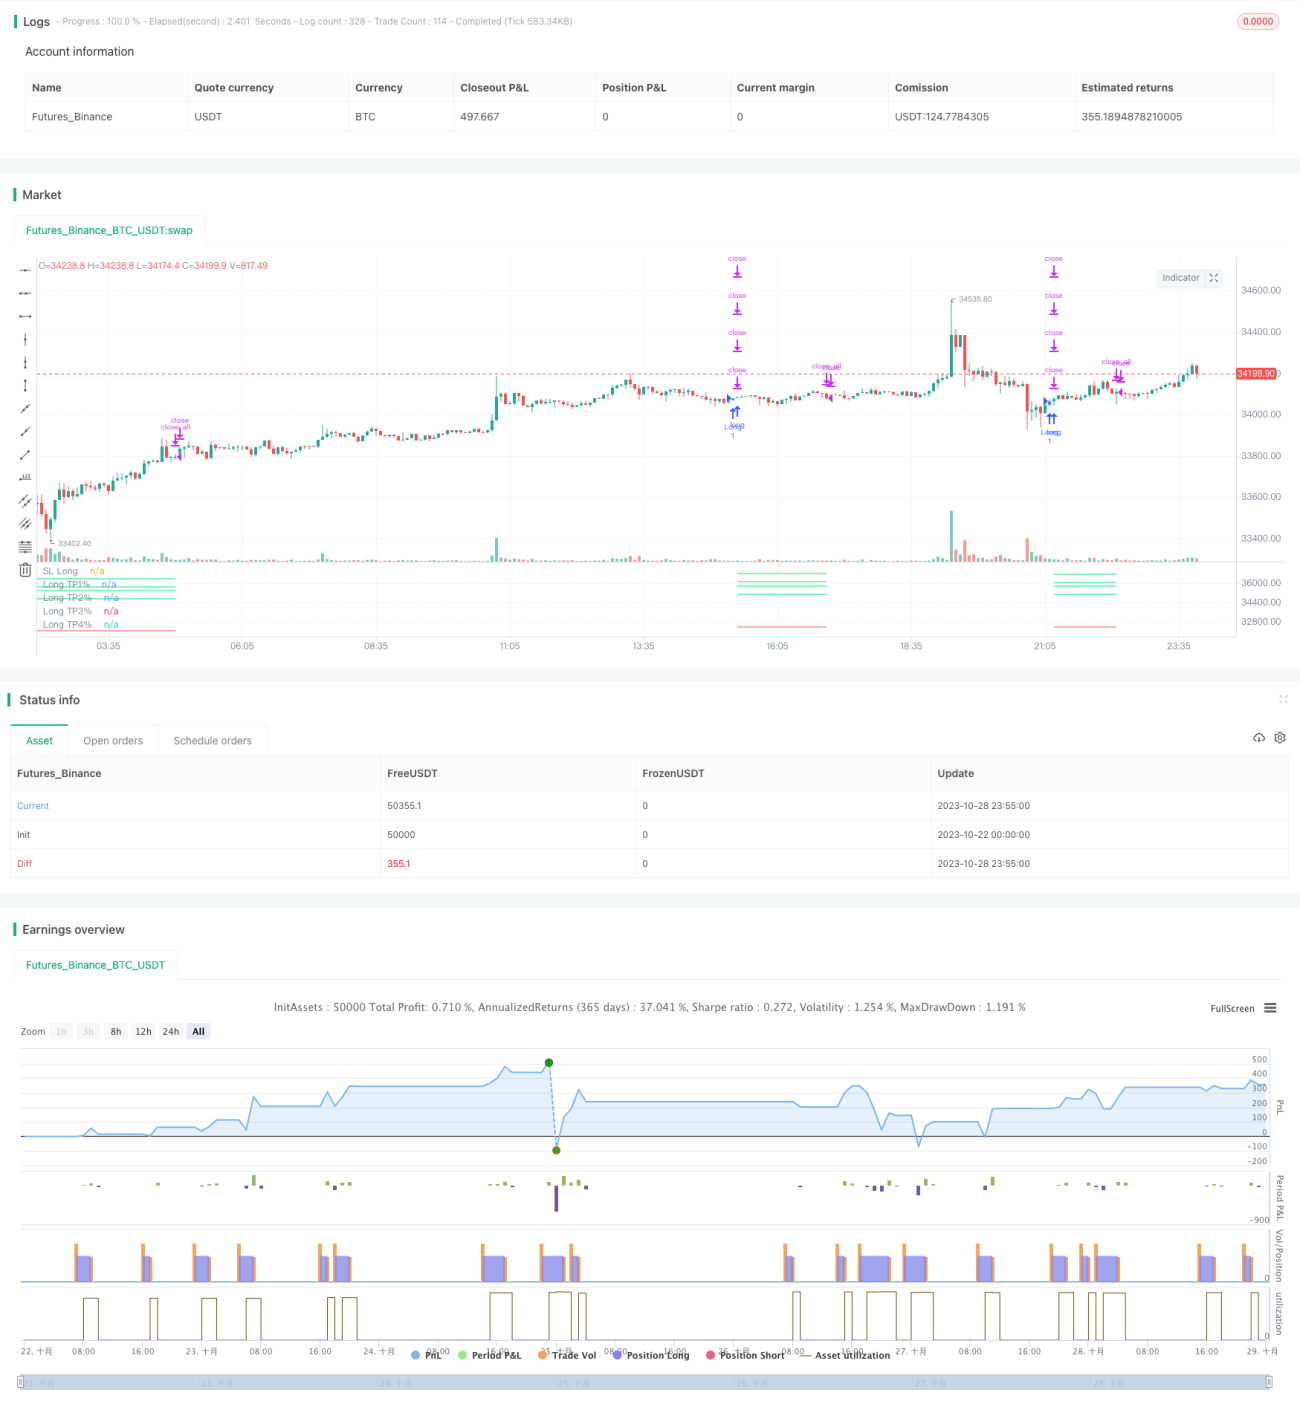

/*backtest
start: 2023-10-22 00:00:00
end: 2023-10-29 00:00:00
period: 5m
basePeriod: 1m
exchanges: [{"eid":"Futures_Binance","currency":"BTC_USDT"}]
*/

// This source code is subject to the terms of the Mozilla Public License 2.0 at https://mozilla.org/MPL/2.0/
// © TrendCrypto2022
//@version=5
// strategy("Take profit Multi timeframe", overlay=true, margin_long=100, margin_short=100)
takepercent  = input.bool(title="Take profit %", defval=true ,group="Set up take profit")
takemtf  = input.bool(title="Take profit Multi timeframe", defval=false ,group="Set up take profit")

//Paste your strategy at here. This is example strategy. I use WaveTrend indicator

//WaveTrend indicator
n1 = input(10, "Channel Length")
n2 = input(21, "Average Length")
oblv1 = input(60, "Over Bought Lv 1")
oblv2 = input(53, "Over Bought Lv 2")
oslv1 = input(-60, "Over Sold Lv 1")
oslv2 = input(-53, "Over Sold Lv 2")
 
ap = hlc3 
esa = ta.ema(ap, n1)
d = ta.ema(math.abs(ap - esa), n1)
ci = (ap - esa) / (0.015 * d)
tci = ta.ema(ci, n2)
 
wt1 = tci
wt2 = ta.sma(wt1,4)

//Strategy
buy = ta.crossover(wt1, wt2) and wt1 < -40
if (buy)
    strategy.entry("Long", strategy.long)


//Resistant in time D and 4H
ema_len1 = input.int(title='Ema1', defval=100, group='Take profit Mtf')
ema_len2 = input.int(title='Ema2', defval=200, group='Take profit Mtf')
src = input.source(title='Source', defval=close, group='Take profit Mtf')
tf1 = input.timeframe(title='Time frame 1', defval='240', group='Take profit Mtf')
tf2 = input.timeframe(title='Time frame 2', defval='D', group='Take profit Mtf')
htf_ma1 = ta.ema(src, ema_len1)
htf_ma2 = ta.ema(src, ema_len2)
ema1 = request.security(syminfo.tickerid, tf1, htf_ma1)
ema2 = request.security(syminfo.tickerid, tf1, htf_ma2)
ema3 = request.security(syminfo.tickerid, tf2, htf_ma1)
ema4 = request.security(syminfo.tickerid, tf2, htf_ma2)

//Plot
plotema1 = plot(ema1, color=color.new(color.silver, 0), style=plot.style_line, linewidth=1, offset=0, title='Ema100 4h', display=display.none)
plotema2 = plot(ema2, color=color.new(color.silver, 0), style=plot.style_line, linewidth=1, offset=0, title='Ema200 4h', display=display.none)
plotema3 = plot(ema3, color=color.new(color.orange, 20), style=plot.style_line, linewidth=1, offset=0, title='Ema100 D', display=display.none)
plotema4 = plot(ema4, color=color.new(color.orange, 20), style=plot.style_line, linewidth=1, offset=0, title='Ema200 D', display=display.none)

//Label take profit multitime frame
var label labelema1 = na
label.delete(labelema1)
labelema1 := label.new(x=time + 120, y=ema1, text='\n*****Ema100 4H: ' + str.tostring(math.round(ema1,4)) + '', color=color.new(#000000, 100), textcolor =  color.yellow, size=size.small, style=label.style_label_left, xloc=xloc.bar_time, yloc=yloc.price)

var label labelema2 = na
label.delete(labelema2)
labelema2 := label.new(x=time + 120, y=ema2, text='\n*****Ema200 4H: ' + str.tostring(math.round(ema2,4)) + '', color=color.new(#000000, 100), textcolor = color.yellow, size=size.small, style=label.style_label_left, xloc=xloc.bar_time, yloc=yloc.price)

var label labelema3 = na
label.delete(labelema3)
labelema3 := label.new(x=time + 120, y=ema3, text='\n*****Ema100 1D: ' + str.tostring(math.round(ema3,4)) + '', color=color.new(#000000, 100), textcolor = color.yellow, size=size.small, style=label.style_label_left, xloc=xloc.bar_time, yloc=yloc.price)

var label labelema4 = na
label.delete(labelema4)
labelema4 := label.new(x=time + 120, y=ema4, text='\n*****Ema200 1D: ' + str.tostring(math.round(ema4,4)) + '', color=color.new(#000000, 100), textcolor = color.yellow, size=size.small, style=label.style_label_left, xloc=xloc.bar_time, yloc=yloc.price)

//Set up take profit %
percent(pcnt) =>
    strategy.position_size != 0 ? math.round(pcnt / 100 * strategy.position_avg_price / syminfo.mintick) : float(na)
TP1=input.float(3, title="TP1 %", step=0.1, group="Take profit %")
TP2=input.float(5, title="TP2 %", step=1, group="Take profit %")
TP3=input.float(6, title="TP3 %", step=1, group="Take profit %")
TP4=input.float(8, title="TP4 %", step=1, group="Take profit %")

SL=input.float(5, title="Stop Loss %", step=1, group="Take profit %")
qty1=input.float(5, title="% Close At TP1", step=1, group="Take profit %")
qty2=input.float(5, title="% Close At TP2", step=1, group="Take profit %")
qty3=input.float(5, title="% Close At TP3", step=1, group="Take profit %")
qty4=input.float(5, title="% Close At TP4", step=1, group="Take profit %")
lossPnt_L = percent(SL)

//Set up take profit multi timeframe
a = array.from((ema1), (ema2), (ema3), (ema4))
tpmtf1 = array.min(a)
tpmtf2 = array.min(a, 2)
tpmtf3 = array.min(a, 3)
tpmtf4 = array.min(a, 4)
//Set up exit
long_sl_level = strategy.position_avg_price - lossPnt_L*syminfo.mintick
if takepercent == true
    strategy.exit("TP1%", "Long", qty_percent = qty1, profit = percent(TP1), loss = lossPnt_L)
    strategy.exit("TP2%", "Long", qty_percent = qty2, profit = percent(TP2), loss = lossPnt_L)
    strategy.exit("TP3%", "Long", qty_percent = qty3, profit = percent(TP3), loss = lossPnt_L)
    strategy.exit("TP4%", "Long", qty_percent = qty4, profit = percent(TP3), loss = lossPnt_L)
    strategy.close_all(when= ta.crossunder(wt1, wt2) and wt1 > 0, comment="Close All")


if takemtf == true and array.max(a, 1) > strategy.position_avg_price
    strategy.exit("TP1Mtf", "Long", qty_percent = qty1, limit = tpmtf1, stop = long_sl_level)
    strategy.exit("TP2Mtf", "Long", qty_percent = qty2, limit = tpmtf2, stop = long_sl_level)
    strategy.exit("TP3Mtf", "Long", qty_percent = qty3, limit = tpmtf3, stop = long_sl_level)
    strategy.close_all(when= ta.crossunder(wt1, wt2) and wt1 > 0, comment="Close All")

// Plot TP & SL
long_tp1_level = strategy.position_avg_price + percent(TP1)*syminfo.mintick
long_tp2_level = strategy.position_avg_price + percent(TP2)*syminfo.mintick
long_tp3_level = strategy.position_avg_price + percent(TP3)*syminfo.mintick
long_tp4_level = strategy.position_avg_price + percent(TP4)*syminfo.mintick

plot(strategy.position_size > 0 ? long_sl_level : na, color=color.red, style=plot.style_linebr, title="SL Long")

plot(strategy.position_size > 0 ? long_tp1_level : na, color=color.lime, style=plot.style_linebr, title="Long TP1%")
plot(strategy.position_size > 0 ? long_tp2_level : na, color=color.lime, style=plot.style_linebr, title="Long TP2%")
plot(strategy.position_size > 0 ? long_tp3_level : na, color=color.lime, style=plot.style_linebr, title="Long TP3%")
plot(strategy.position_size > 0 ? long_tp4_level : na, color=color.lime, style=plot.style_linebr, title="Long TP4%")

plot(strategy.position_size > 0 ? tpmtf1 : na, color=color.orange, style=plot.style_linebr, title="Long TP1Mtf", display = display.none)
plot(strategy.position_size > 0 ? tpmtf2 : na, color=color.orange, style=plot.style_linebr, title="Long TP2Mtf", display = display.none)
plot(strategy.position_size > 0 ? tpmtf3 : na, color=color.orange, style=plot.style_linebr, title="Long TP3Mtf", display = display.none)

//Label TP
if strategy.position_size > 0
    var label labellongtp1 = na
    label.delete(labellongtp1)
    labellongtp1 := label.new(x=time + 120, y=long_tp1_level, text='\nTP1: ' + str.tostring(math.round(long_tp1_level,2)) + '', color=color.new(#000000, 100), textcolor = color.lime, size=size.small, style=label.style_label_left, xloc=xloc.bar_time, yloc=yloc.price)
     
    var label labellongtp2 = na
    label.delete(labellongtp2)
    labellongtp2 := label.new(x=time + 120, y=long_tp2_level, text='\nTP2: ' + str.tostring(math.round(long_tp2_level,2)) + '', color=color.new(#000000, 100), textcolor = color.lime, size=size.small, style=label.style_label_left, xloc=xloc.bar_time, yloc=yloc.price)
     
    var label labellongtp3 = na
    label.delete(labellongtp3)
    labellongtp3 := label.new(x=time + 120, y=long_tp3_level, text='\nTP3: ' + str.tostring(math.round(long_tp3_level,2)) + '', color=color.new(#000000, 100), textcolor = color.lime, size=size.small, style=label.style_label_left, xloc=xloc.bar_time, yloc=yloc.price)
        
    var label labellongtp4 = na
    label.delete(labellongtp4)
    labellongtp4 := label.new(x=time + 120, y=long_tp4_level, text='\nTP4: ' + str.tostring(math.round(long_tp4_level,2)) + '', color=color.new(#000000, 100), textcolor = color.lime, size=size.small, style=label.style_label_left, xloc=xloc.bar_time, yloc=yloc.price)


More