Dual EMA Crossover Strategy

Overview
The Dual EMA Crossover strategy is a typical trend following strategy. It uses two EMA lines of different periods and generates trading signals based on their crossover. When the faster EMA crosses above the slower EMA, a buy signal is generated. When the faster EMA crosses below the slower EMA, a sell signal is generated. This strategy can track medium-long term trends and capture trading opportunities in trend initiation stages.
Strategy Logic
The key components of this strategy are:
-
Set lengths for the faster EMA and slower EMA. Here the faster EMA length is 12, slower EMA is 26.
-
Calculate the faster EMA and slower EMA. The faster EMA reacts quicker while the slower EMA is more stable.
-
Determine EMA crossover situations to generate trading signals. When faster EMA crosses above slower EMA, a buy signal is generated. When faster EMA crosses below slower EMA, a sell signal is generated.
-
Enter trades based on signals. When going long, existing short positions are closed first before opening long positions. Vice versa.
-
Set stop loss points. When going long, stop loss is triggered if price falls below previous low by a set percentage. Vice versa.
-
Exit trades based on signals. Long positions are closed when faster EMA crosses below slower EMA. Short positions closed when faster EMA crosses above slower EMA.
The logic is simple and intuitive. EMA crossover determines trend direction and strength. Faster EMA reacts to short term price changes quickly while slower EMA responds to long term trends steadily. Crossover of the two lines is a classic way to detect trend changes.
Advantage Analysis
The advantages of this strategy are:
-
Simple concept easy to understand and implement. EMA and crossover are recognized effective indicators and signals.
-
Can effectively track medium-long term trends and capture opportunities early.
-
Dual EMA setup avoids noise from short term market fluctuations.
-
Has clear entry rules, exit rules and stop loss rules. No overholding positions.
-
Only needs a few parameters, not prone to overfitting. Easy parameter tuning suitable for beginners.
-
Good backtest results, viable for live trading. Can be used standalone or combined with other strategies.
Risk Analysis
Some risks of this strategy:
-
Dual EMA crossover prone to generating false signals and whipsaws. Parameters need tuning to filter invalid signals.
-
Cannot handle ranging and trend reversal situations well. Needs confirmation from other indicators.
-
Dual EMA strategy tends to chase highs and sell lows. Position sizing and profit taking should be controlled.
-
Backtest results may be overfitted to some extent. Parameter sensitivity should be tested for robustness.
-
No timely stop loss can lead to large losses. Reasonable stop loss levels should be set.
-
Transaction costs may affect actual profitability. Commission factors for different products should be considered.
Improvement Areas
Some ways to improve the strategy:
-
Optimize EMA period parameters to find best combination, using walk forward optimization and machine learning.
-
Add trend filter indicators like ADX, CCI etc. to avoid trading in uncertain trends.
-
Add volume indicators like trading volume, on balance volume to ensure real trading is driving signals.
-
Implement dynamic stop loss to automatically adjust stops based on market volatility.
-
Combine correlated products to utilize correlation for risk management.
-
Introduce machine learning for parameter optimization, feature engineering, signal filtering etc.
-
Consider transaction costs, adjust stops and size to reduce trade frequency.
-
Customize parameters based on product characteristics to improve adaptiveness.
-
Design composite strategy framework, combining with other strategies to improve robustness.
These improvements can make the strategy more robust and profitable for live trading.
Conclusion
This strategy uses dual EMA crossover to generate trading signals and can effectively track medium-long term trends. The advantages lie in its simplicity and good backtest results, making it easy for beginners to use. But risks exist and should be managed through parameter optimization, adding indicators, dynamic stops, optimizing trade costs etc. The strategy can be used standalone or combined with others for added practicality.
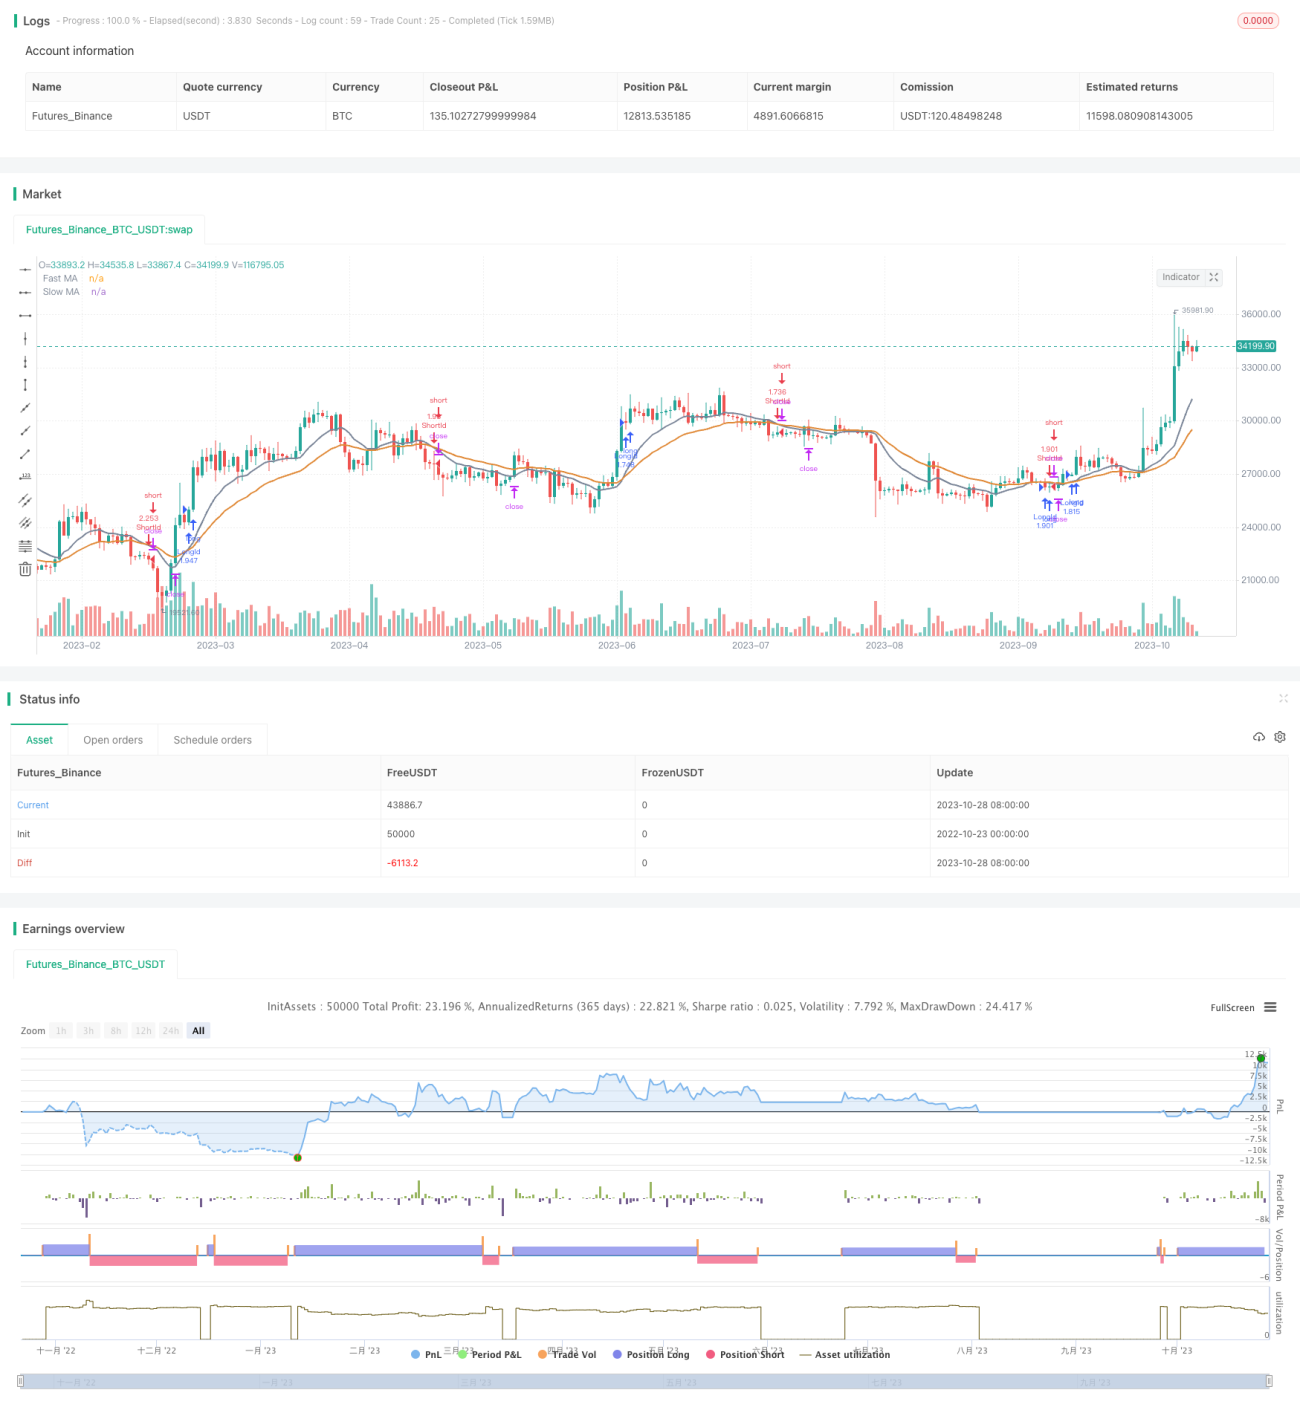
/*backtest
start: 2022-10-23 00:00:00
end: 2023-10-29 00:00:00
period: 1d
basePeriod: 1h
exchanges: [{"eid":"Futures_Binance","currency":"BTC_USDT"}]
*/

//@version=2

strategy(title = "EMA Cross Strategy", shorttitle = "EMA Cross",calc_on_order_fills=true,calc_on_every_tick =true, initial_capital=21000,commission_value=.25,overlay = true,default_qty_type = strategy.percent_of_equity, default_qty_value = 100)
StartYear = input(2018, "Backtest Start Year")- 1