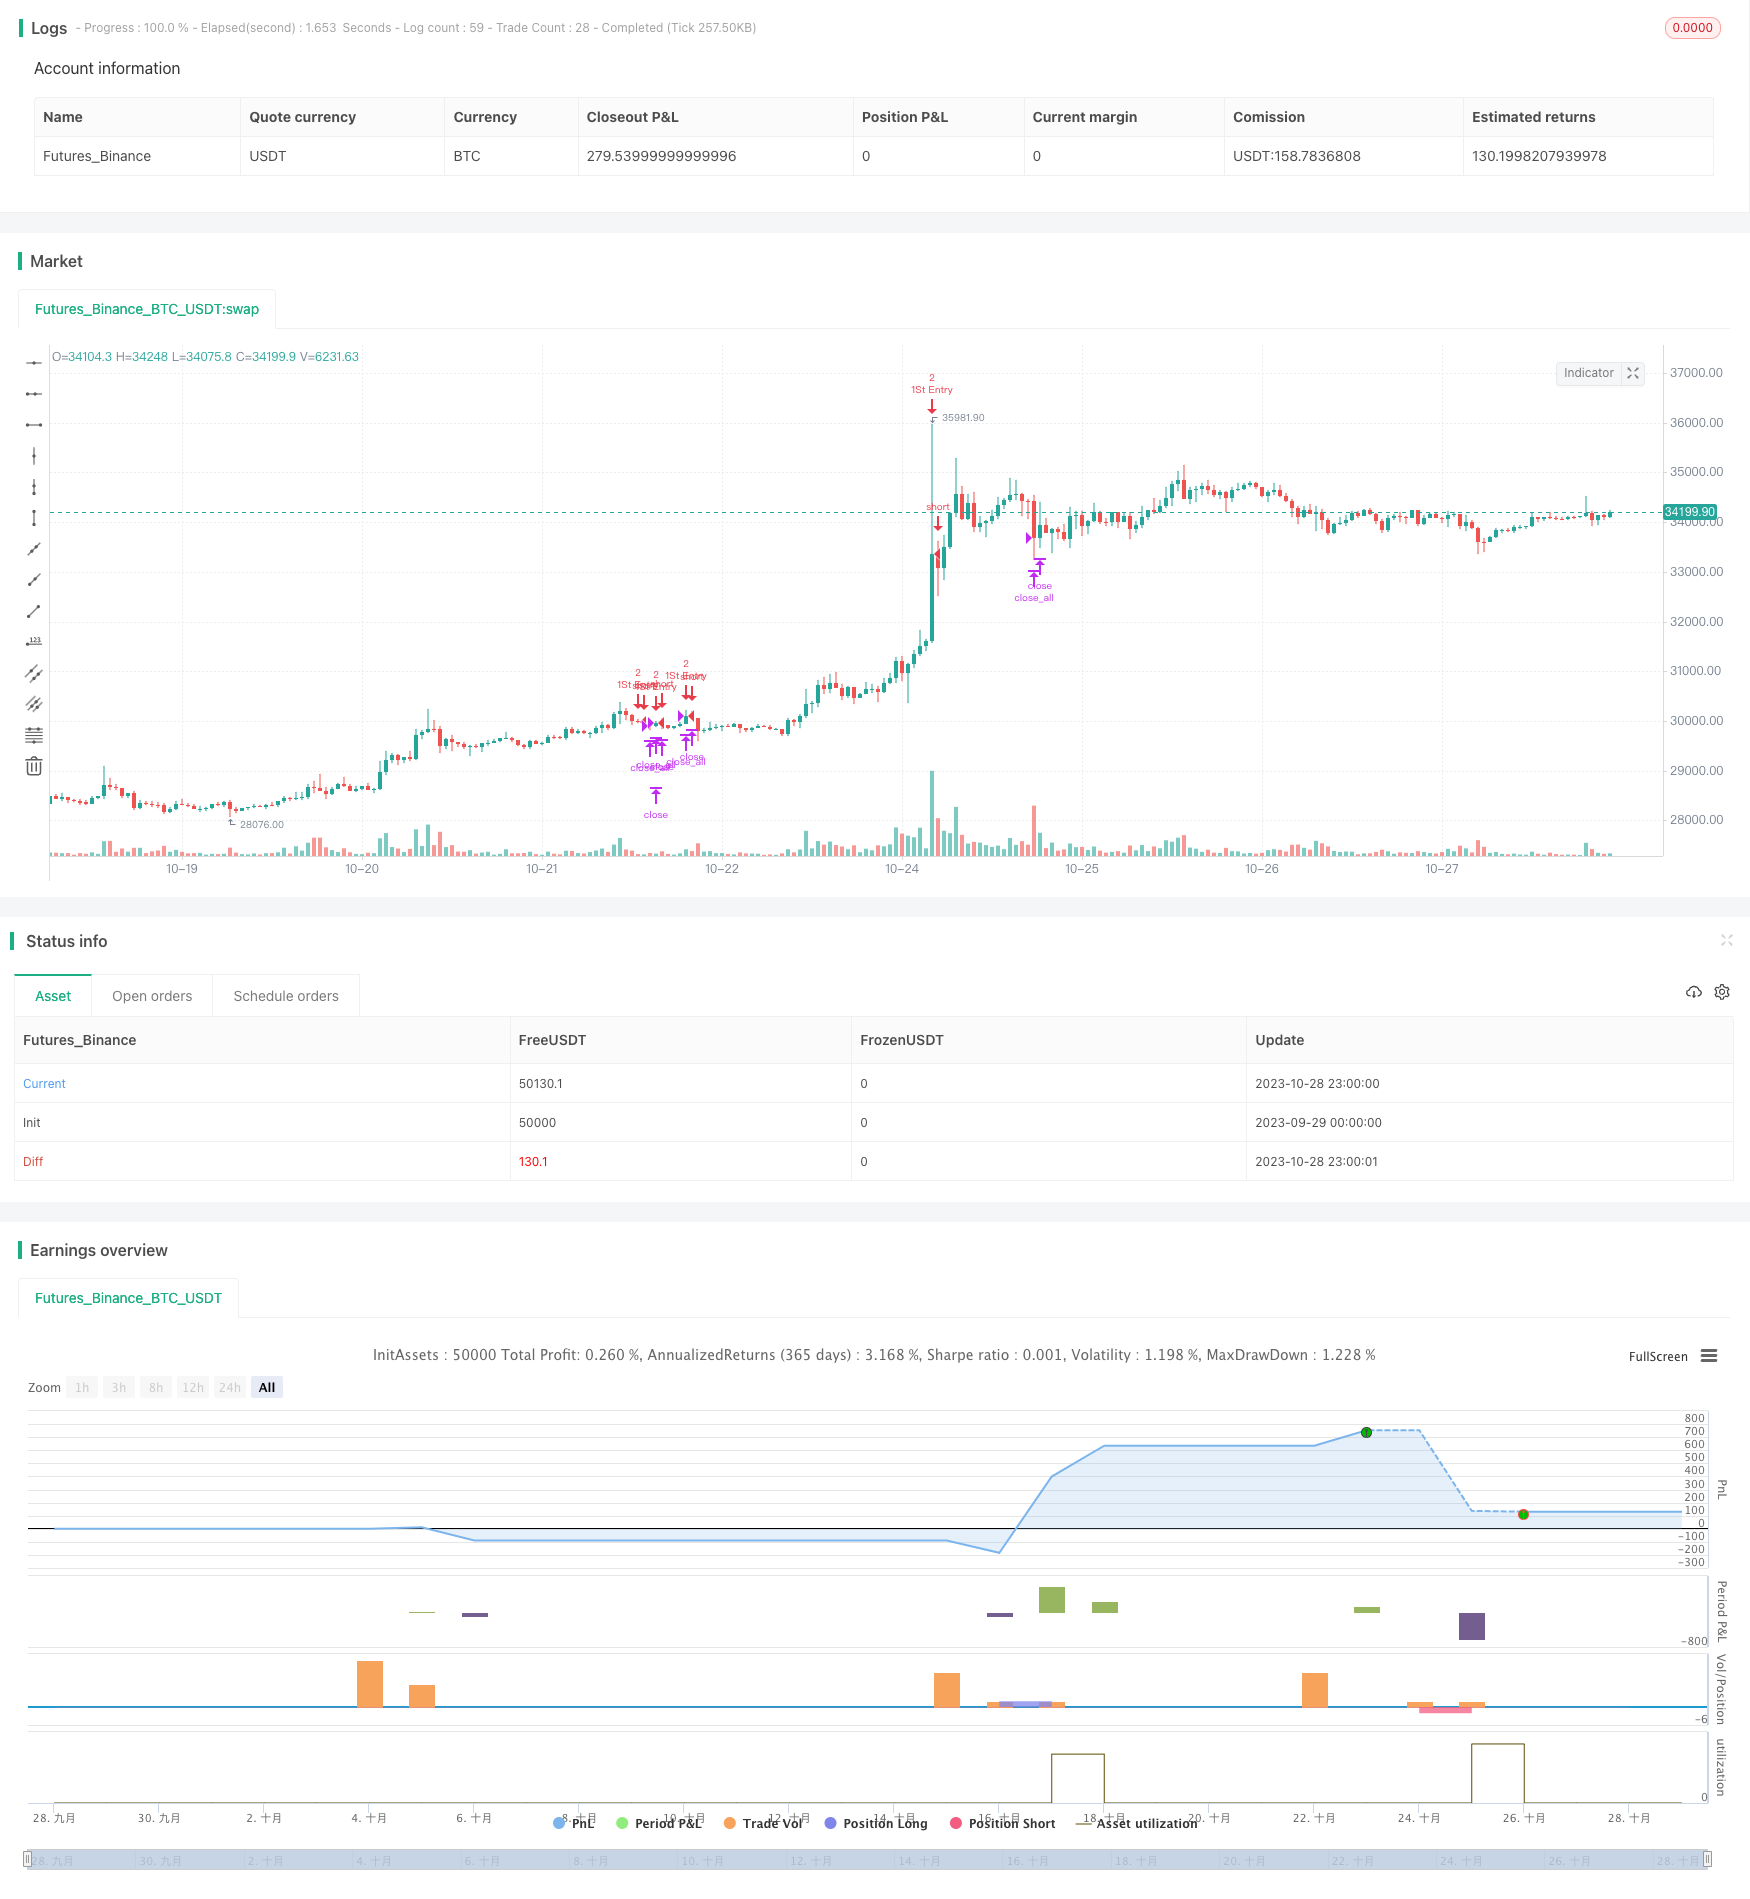
概述
该策略利用RSI指标在不同时间周期上的组合,判断当前市场处于超买或超卖状态,并结合价格与移动均线的关系来发出买入和卖出信号。目标是在跌势中买入,在涨势中卖出,达到在盘整中获利。
策略原理
计算5分钟、15分钟、1小时的RSI值,当5分钟、15分钟和1小时的RSI同时低于25时,判断为超卖现象,产生买入信号;当5分钟、15分钟和1小时的RSI同时高于75时,判断为超买现象,产生卖出信号。
价格突破21日移动均线也作为交易信号,如果价格低于移动均线,则产生买入信号;如果价格高于移动均线,则产生卖出信号。
根据持仓情况,设定首次交易数量和加仓规则:首次开仓定为2手,之后每次加仓1手,直到持仓达到2手为止。
当亏损达到3%时止损。当获利达到1%时止盈。
策略优势
使用多时间框架RSI指标组合判断超买超卖,提高信号的可靠性。
结合移动均线产生额外交易信号,扩大交易机会。
设定头寸控制和盈亏比例止盈止损规则,控制风险。
采用定量加仓方式扩大获利空间。
策略风险
RSI指标存在回调风险,即RSI达到超买超卖临界点后,价格可能继续运行一段时间而未发生反转。此时如果盲目跟随RSI信号交易,可能导致亏损。
移动均线产生的交易信号可能出现误导。当价格出现剧烈波动时,移动均线无法及时跟踪价格变化。
错误设定头寸规模和盈亏比可能导致风险控制不当。
需要合理设定加仓条件。如果加仓过于放开,可能导致亏损扩大。
优化方向
调整RSI参数,测试不同的RSI周期参数组合,找到更可靠的超买超卖信号。
测试不同的参数移动均线作为辅助交易信号。也可以测试其他技术指标。
优化头寸控制和止损止盈规则,设定更科学的风险控制机制。
优化加仓条件,防止加仓导致亏损放大。也可以考虑替代加仓方式,改为指数加仓。
总结
本策略利用RSI的多时间框架组合判断趋势潜力,以获取较高的胜率。同时辅以移动均线产生交易信号,扩大交易机会。采用头寸控制、止损止盈、定量加仓等规则进行风险控制。总体来说,该策略整合了趋势、反转指标,兼顾追踪趋势和逢低吸纳的交易逻辑,在盘整行情中可获得不错的效果。但仍需进一步测试优化,使风险控制机制更加科学合理,从而获得更稳定的交易表现。
/*backtest
start: 2023-09-29 00:00:00
end: 2023-10-29 00:00:00
period: 1h
basePeriod: 15m
exchanges: [{"eid":"Futures_Binance","currency":"BTC_USDT"}]
*/

//@version=3
strategy("5M_RSI_Strategy", overlay=true, pyramiding = 1)
len =14
Initial_Trade_Size = 2
up = rma(max(change(close), 0), len)
down = rma(-min(change(close), 0), len)
rsi = down == 0 ? 100 : up == 0 ? 0 : 100 - (100 / (1 + up / down))
RSI_1h = request.security(syminfo.tickerid, "60", rsi)
RSI_3h = request.security(syminfo.tickerid, "180", rsi)
RSI_15m = request.security(syminfo.tickerid, "15", rsi)
RSI_5m = request.security(syminfo.tickerid, "5", rsi)
RSI_1m = request.security(syminfo.tickerid, "1", rsi)
ema21_5 = ema(request.security(syminfo.tickerid, "5", close), 21)
ema21_15 = ema(request.security(syminfo.tickerid, "15", close), 21)
//(RSI_3h<=25) and  (RSI_1h<=25) and (RSI_15m<=25) and
Positive = ((RSI_5m<=25) and (RSI_15m<=25) and (RSI_1h<=25))?true:false
//alertcondition(Positive, title='POS', message='POS')
//plotshape(Positive, style=shape.triangleup,location=location.belowbar, color=green,size =size.tiny)
Negative = (( RSI_5m>=75) and ( RSI_15m>=75) and ( RSI_1h>=75))?true:false
//alertcondition(Negative, title='NEG', message='NEG')
//plotshape(Negative, style=shape.triangledown,location=location.abovebar, color=red,size=size.tiny)          Positive and   Negative and

lastordersize = abs(strategy.position_size)>=Initial_Trade_Size?abs(strategy.position_size):Initial_Trade_Size
//lastordersize =1
// and ((ema21_15-low)/ema21_15) > 0.077
//Adding to position rules
if (abs(strategy.position_size) >= Initial_Trade_Size and (abs(close - strategy.position_avg_price)/abs(strategy.position_avg_price)>0.03))
    if(strategy.position_avg_price > close and strategy.position_size > 0)
        strategy.entry("Add", strategy.long , qty = lastordersize , when = true)
    if(strategy.position_avg_price < close and strategy.position_size < 0)
        strategy.entry("Add", strategy.short, qty = lastordersize , when = true)
if (strategy.position_size == 0)
    if (Positive or ((ema21_5-low)/ema21_5) > 0.07)
        strategy.entry("1St Entry", strategy.long , qty = lastordersize , when = true)
    // and ((high-ema21_15)/ema21_15) > 0.077
    if (Negative or ((high-ema21_5)/ema21_5) > 0.07)
        strategy.entry("1St Entry", strategy.short, qty = lastordersize , when = true)
//lastordersize := lastordersize * 2
//or (strategy.openprofit / abs(strategy.position_size * close))>=0.01
if(cross(ema21_5, high) or cross(ema21_5, low))
    strategy.close_all()