Trendless MACD Strategy

Overview
This strategy uses the method of eliminating the trend of stock prices to observe the MACD indicator more clearly. By calculating the DEMA fast line and DEMA slow line, the MACD line and signal line are derived. Trading signals are generated by crossing between the MACD line and signal line. The strategy also incorporates date and month condition filters and stop loss logic to form a more complete system.
Strategy Logic
Firstly, the EMA of price is calculated to eliminate the price trend and obtain the detrended EMA. Then the fast line DEMA, slow line DEMA and MACD line are calculated based on EMA. The fast line DEMA is calculated by: first calculating EMA1 of the fast line, then calculating EMA2 of EMA1, and finally calculating DEMA=(2*EMA1-EMA2). The slow line DEMA and signal line are calculated similarly. After obtaining the MACD line (fast line DEMA - slow line DEMA) and the signal line, a buy signal is generated when the MACD line crosses above the signal line, and a sell signal is generated when the MACD line crosses below the signal line. Finally, combine the date and month filters, and set stop loss logic.
The core logic of this strategy is:
-
Eliminate the price trend to see the MACD indicator more clearly.
-
Calculate DEMA fast line, DEMA slow line to derive MACD line and signal line.
-
MACD line and signal line crossover generate trading signals.
-
Add date and month filters.
-
Set stop loss logic.
Advantage Analysis
The main advantages of this strategy are:
-
Eliminating the price trend can reveal the crossover situation of MACD more clearly without being misled by the trend.
-
Using DEMA algorithm to calculate MACD filters out some noise and makes the signal clearer.
-
Combining date and month filters can reduce unnecessary trades.
-
The stop loss logic can cut losses in time and control risks.
-
Using crossover to generate signals reduces incorrect trades.
-
Overall, combining trend elimination, DEMA calculation and condition filters, this strategy can generate relatively clear and reliable trading signals.
Risk Analysis
Some risks of this strategy need attention:
-
After eliminating the trend, MACD crossover signals may increase, which needs live testing to verify feasibility.
-
Although DEMA algorithm filters some noise, there can still be many false signals in the indicator calculation.
-
The date and month filter conditions may be too rigid, missing some trading opportunities.
-
The stop loss position needs to be reasonably set, too loose will increase risk, too tight will stop loss frequently.
-
The strategy relies mainly on MACD, if the market is not suitable for this indicator, the performance may be affected.
-
There is still large room for parameter optimization, which needs further testing through backtest and live trading.
Solutions:
-
Add other indicator confirmation to avoid false signals.
-
Optimize date filter conditions appropriately.
-
Test and optimize stop loss points carefully.
-
Add trend judgment mechanism to avoid trading against the trend.
-
Comprehensive backtest and parameter optimization to improve stability.
Optimization Directions
The strategy can be optimized in the following aspects:
-
Test different price moving averages to find a better alternative to EMA.
-
Try different parameter combinations to optimize the MACD fast line, slow line and signal line lengths.
-
Add auxiliary indicators like volume to avoid false signals.
-
Optimize stop loss strategies, set reasonable moving or order stop loss.
-
Optimize the date and month filter conditions to make them more flexible.
-
Add trend judgment to avoid trading against the trend.
-
Comprehensive parameter optimization to improve stability.
-
Backtest on longer time period to check long term performance.
-
Live trading to verify and further modify the parameters based on real trading.
Summary
In summary, this strategy uses the idea of eliminating the trend and calculating DEMA MACD combined with date filters to generate trading signals, which is a simple but feasible strategy idea. Its biggest advantage is revealing the MACD pattern clearly without being affected by the price trend. However, there are still some risks of this strategy that need parameter optimization and risk control measures to be implemented for practical application. There is also large room for optimization, and with sufficient verification and optimization, this strategy can become a stable and reliable short-term trading system.
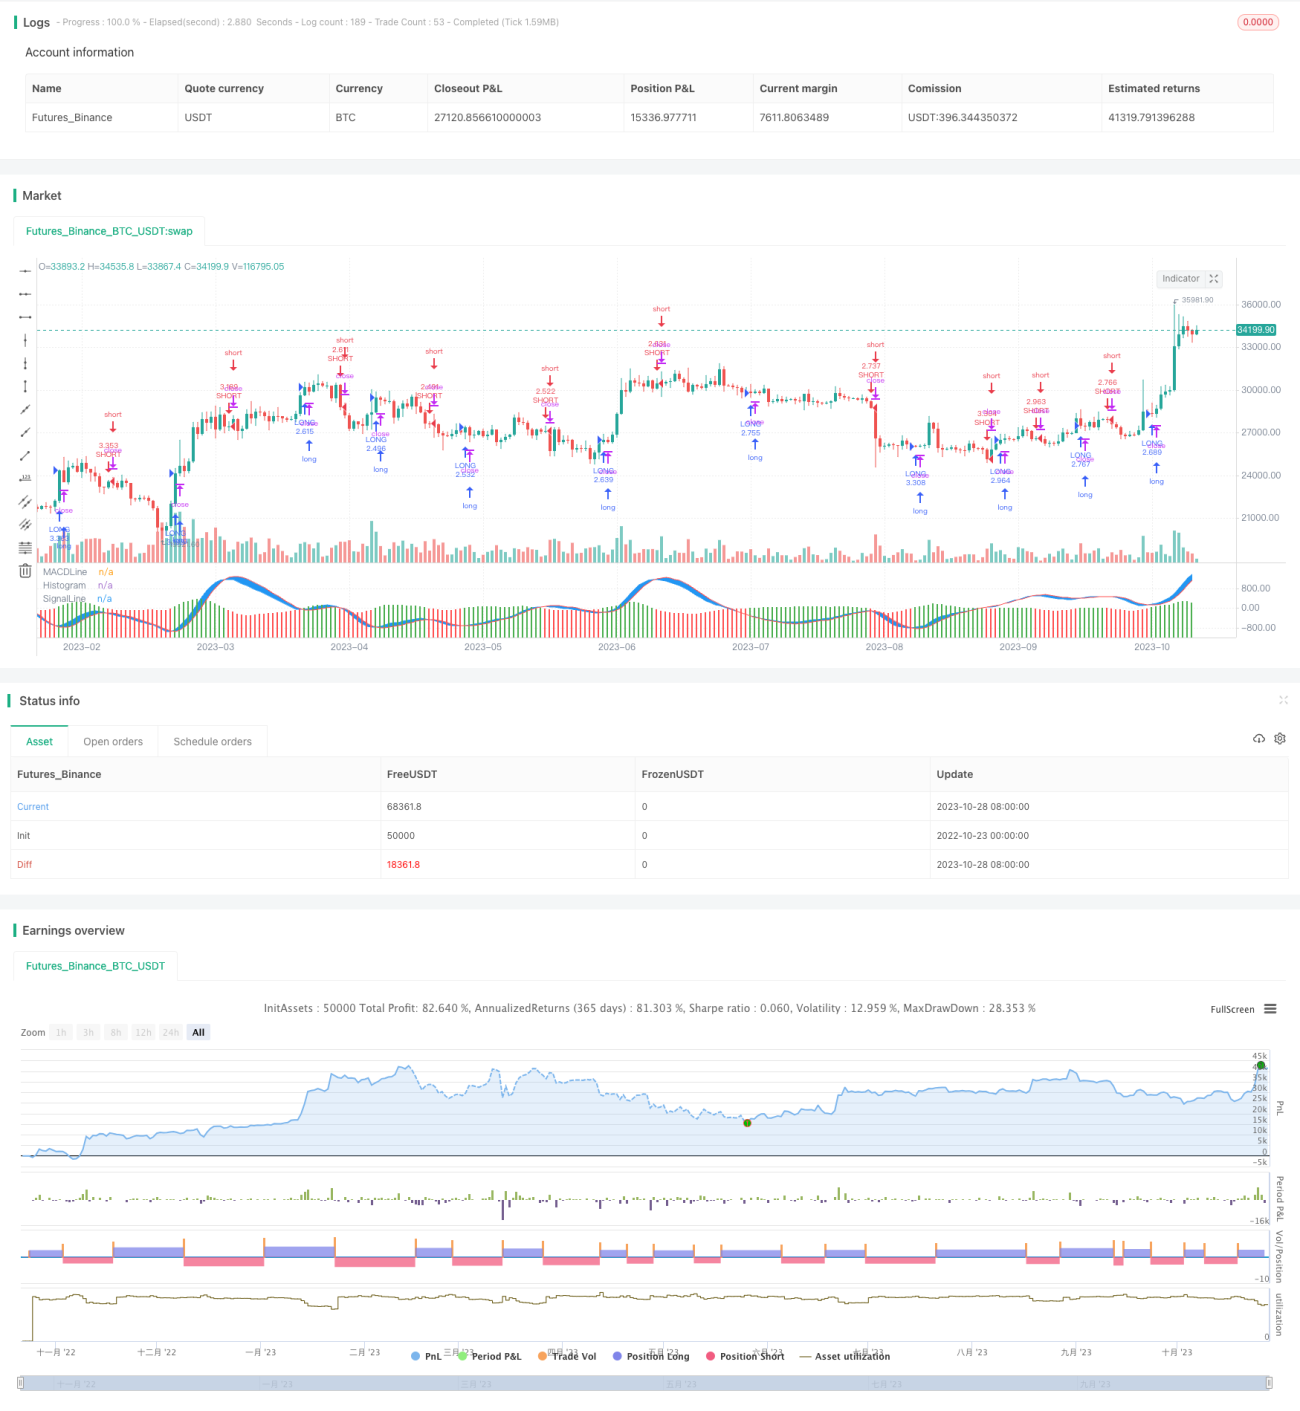
/*backtest
start: 2022-10-23 00:00:00
end: 2023-10-29 00:00:00
period: 1d
basePeriod: 1h
exchanges: [{"eid":"Futures_Binance","currency":"BTC_USDT"}]
*/

//@version=2

strategy(title = "Trendless MACD  Strategy",shorttitle="MACD-T Strategy",default_qty_type = strategy.percent_of_equity, default_qty_value = 100,commission_type=strategy.commission.percent,commission_value=0.01,initial_capital=100000)
- 1