RSI Long Short Automated Trading Strategy

Overview
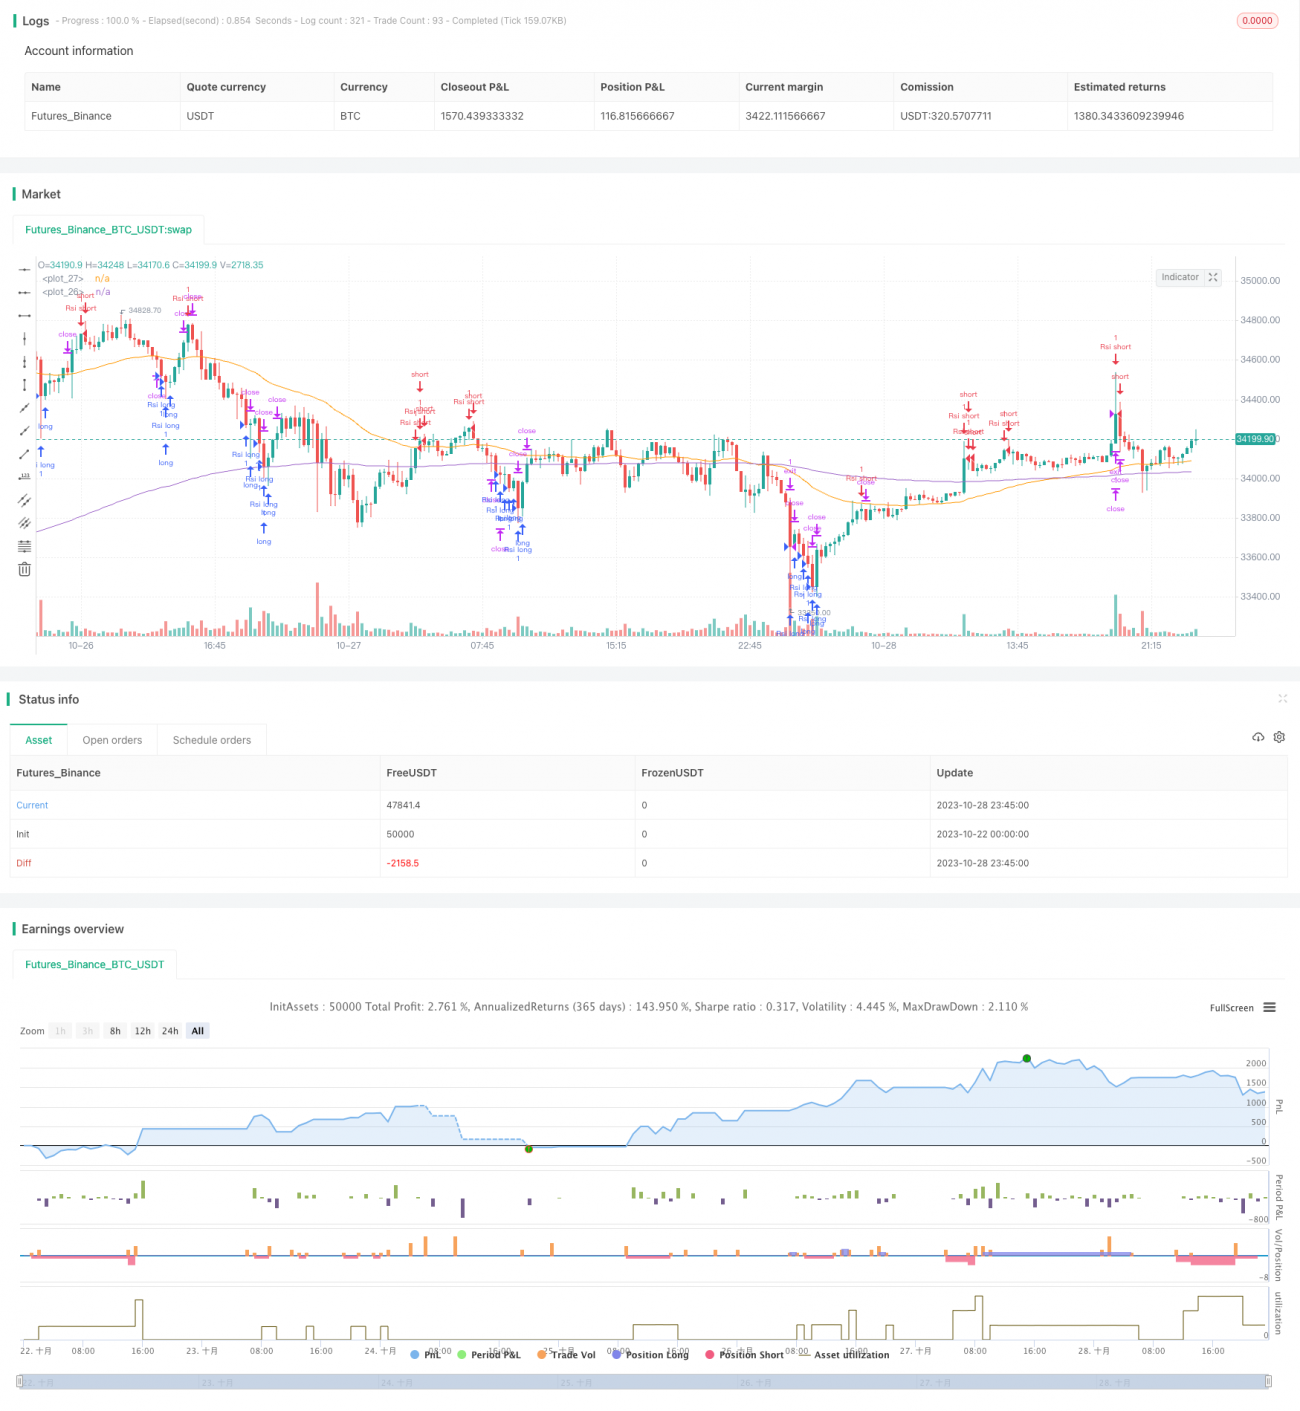
This strategy designs an automated trading system for long and short based on the Relative Strength Index (RSI) indicator. It can automatically generate long and short signals when RSI reaches overbought or oversold levels and conduct automated trading.
Strategy Logic
The strategy calculates the RSI values in the range of 0-100 based on the price rises and falls within a certain period. When RSI is below 30, it is oversold status. When RSI is above 70, it is overbought status. According to this rule, the strategy automatically goes long when RSI reaches the oversold zone and goes short when RSI reaches the overbought zone.
Specifically, the strategy first calculates the 15-period RSI. When the RSI falls below 20, it is considered oversold. At this time, when the price breaks above the 200-day moving average, a long position is opened. When the RSI rises above 80, it is considered overbought. At this time, a short position is opened. After going long or short, take profit and stop loss are set to exit positions.
In addition, the strategy draws corresponding landmark lines and labels when price signals occur to make trading signals more intuitive.
Advantages of the Strategy
- The strategy idea is clear and easy to understand and implement
- Based on the RSI indicator, the judgment of overbought and oversold is accurate
- Fully automated trading without manual intervention
- Take profit and stop loss set to effectively control risks
- Trading signals intuitive and easy to monitor
Risks of the Strategy
- RSI indicator has some lagging, may cause misjudgement
- Fixed overbought and oversold thresholds are not suitable for all products
- Improper stop loss setting may cause greater losses
- Trading with the major trend in trending markets may cause losses
Risk control measures include: optimizing RSI parameters, adjusting overbought and oversold thresholds to suit different products, reasonably setting stop loss, combining with trend indicators to avoid trading against the trend.
Directions for Strategy Optimization
- Optimize RSI parameters to improve the accuracy of judging overbought and oversold
- Confirm trading signals with other indicators such as KDJ, MACD etc.
- Optimize stop loss setting according to market conditions
- Add trend judgment to avoid reverse operations
- Set equity curve tracking stop loss
- Develop risk control module to control single and overall risks
Summary
Overall this is an automated trading strategy using the RSI indicator to judge overbought and oversold conditions. It generates trading signals when RSI reaches extreme overbought or oversold levels, and can automatically conduct long and short trading. The strategy idea is simple and clear, easy to implement, and suitable as a basic automated trading strategy. But RSI indicator has some lagging, so it is recommended to optimize it with other indicators to improve signal accuracy. In addition, attention should be paid to risk control, optimizing the stop loss mechanism, developing risk control modules to reduce trading risks. If optimized and verified in live trading, the strategy can become an effective automated system for long and short trading.
/*backtest
start: 2023-10-22 00:00:00
end: 2023-10-29 00:00:00
period: 15m
basePeriod: 5m
exchanges: [{"eid":"Futures_Binance","currency":"BTC_USDT"}]
*/

//@version=5
strategy("RSI Improved strategy", overlay=true)
higherTF1 = input.timeframe('15' , "Resolution", options = ['5', '15', '1H', 'D', 'W', 'M'])
dailyopen = request.security(syminfo.tickerid, higherTF1, close)- 1