EMA and MAMA Indicators Based Trading Strategy

Overview
This strategy is based on the EMA (Exponential Moving Average) and MAMA (MESA Adaptive Moving Average) indicators to determine the trend direction and generate trading signals according to their crossovers. EMA is often used to judge the market trend direction, while MAMA can more accurately capture market turning points. Using both can improve the performance of the strategy.
Strategy Logic
-
Calculate the fast EMA and slow EMA, which reflect the short-term and long-term trends of the market respectively.
-
Calculate the MAMA and FAMA lines, which are adaptive moving averages.
-
When the fast EMA crosses above the slow EMA, a buy signal is generated.
-
When the fast EMA crosses below the slow EMA, a sell signal is generated.
-
When MAMA crosses above FAMA, a buy signal is generated.
-
When MAMA crosses below FAMA, a sell signal is generated.
-
Crossovers of MAMA and FAMA can be used to confirm EMA signals or provide early detection of trend turns.
Specifically, the strategy first calculates the fast EMA (fl) and slow EMA (sl), reflecting short-term and long-term trends respectively.
Then it calculates MAMA and FAMA based on John Ehlers' formula:
-
Calculate the Hilbert Transform of price and extract phase information of the signal.
-
Calculate the instantaneous frequency p based on the phase information.
-
Calculate the weighting factor α based on the p value.
-
Calculate MAMA and FAMA based on α.
Finally, trading signals are generated based on EMA and MAMA/FAMA crossovers:
- Long when EMA crosses above
- Short when EMA crosses below
- Long when MAMA crosses above FAMA
- Short when MAMA crosses below FAMA
Advantage Analysis
This strategy combines the advantages of EMA and MAMA indicators to improve the accuracy of trading signals.
Advantages of EMA:
- Effectively smooth price data and reduce noise
- Track trends well with some lag
- Flexible parameters to adjust sensitivity
Advantages of MAMA:
- Adaptive parameters, no need for manual period setting
- Fast response to capture trend turns early
- Accurately identify support and resistance
Advantages of combining them:
- EMA determines the overall trend
- MAMA verifies signals and detects turns early
- Improved accuracy and win rate of signals
Risk Analysis
The main risks of this strategy:
- EMA and MAMA are lagging indicators, entry signals may have some delay and slippage
- Frequent crossovers in ranging markets causing whipsaws
- Improper parameter settings lead to missing trends or fake signals
Solutions:
- Use stop loss to control loss
- Choose reasonable parameters, avoid being too sensitive
- Combine with other indicators to confirm signals
Optimization Directions
The strategy can be optimized in the following aspects:
- Optimize EMA periods based on symbol characteristics
- Fine tune MAMA alpha sensitivity to better capture turns
- Add other filters like MACD, RSI to avoid fake signals
- Add stop loss to control risks
- Backtest to find optimal parameters
- Automate take profit for maximized profit
Summary
This strategy integrates the strengths of EMA and MAMA indicators to follow the trend and capture turns timely. With parameter optimization and risk control, it can achieve improved win rate and profitability. But users should still apply caution based on personal risk preference.
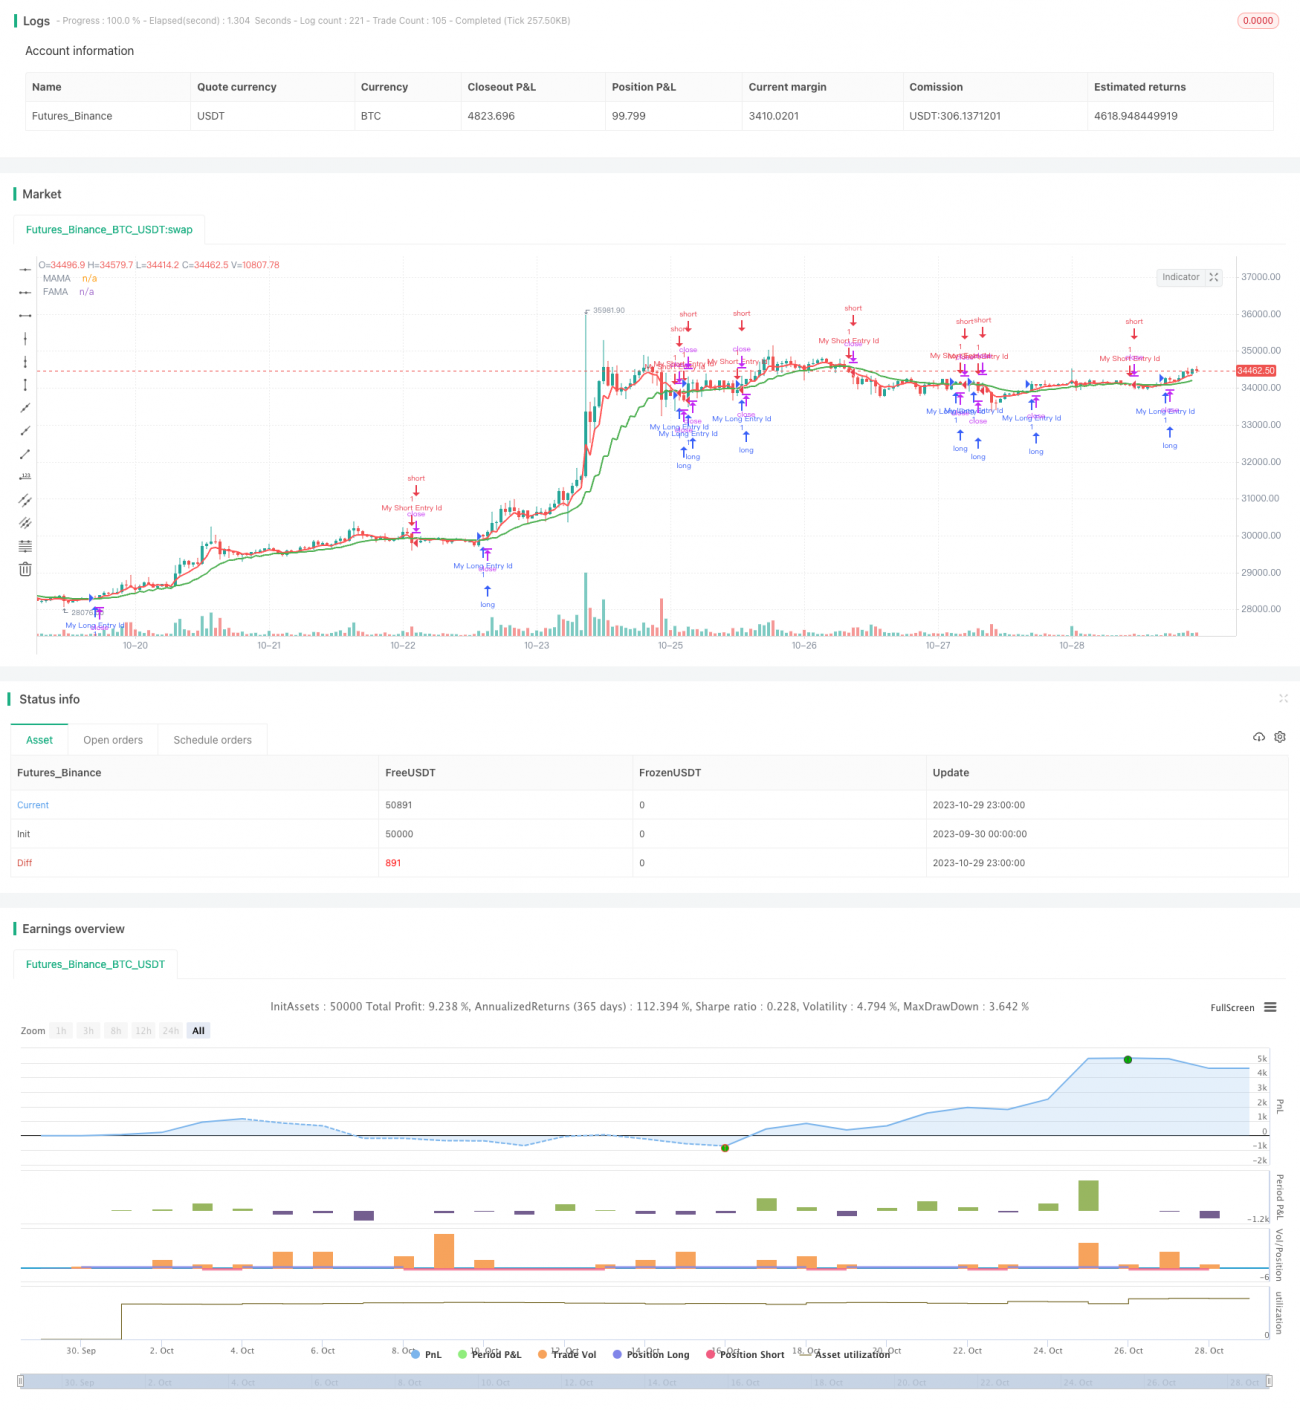
/*backtest
start: 2023-09-30 00:00:00
end: 2023-10-30 00:00:00
period: 1h
basePeriod: 15m
exchanges: [{"eid":"Futures_Binance","currency":"BTC_USDT"}]
*/

//@version=2
strategy("EMAMA strategy", overlay=true)
//This entire strategy is courtesy of LazyBear for programming the original EMAMA system, I simply added a strategy element to everything to round things out.
- 1