Bollinger Bands Reversal Oscillation Trend Strategy

Author: ChaoZhang, Date: 2023-10-31 14:30:45
Tags:

img

Overview

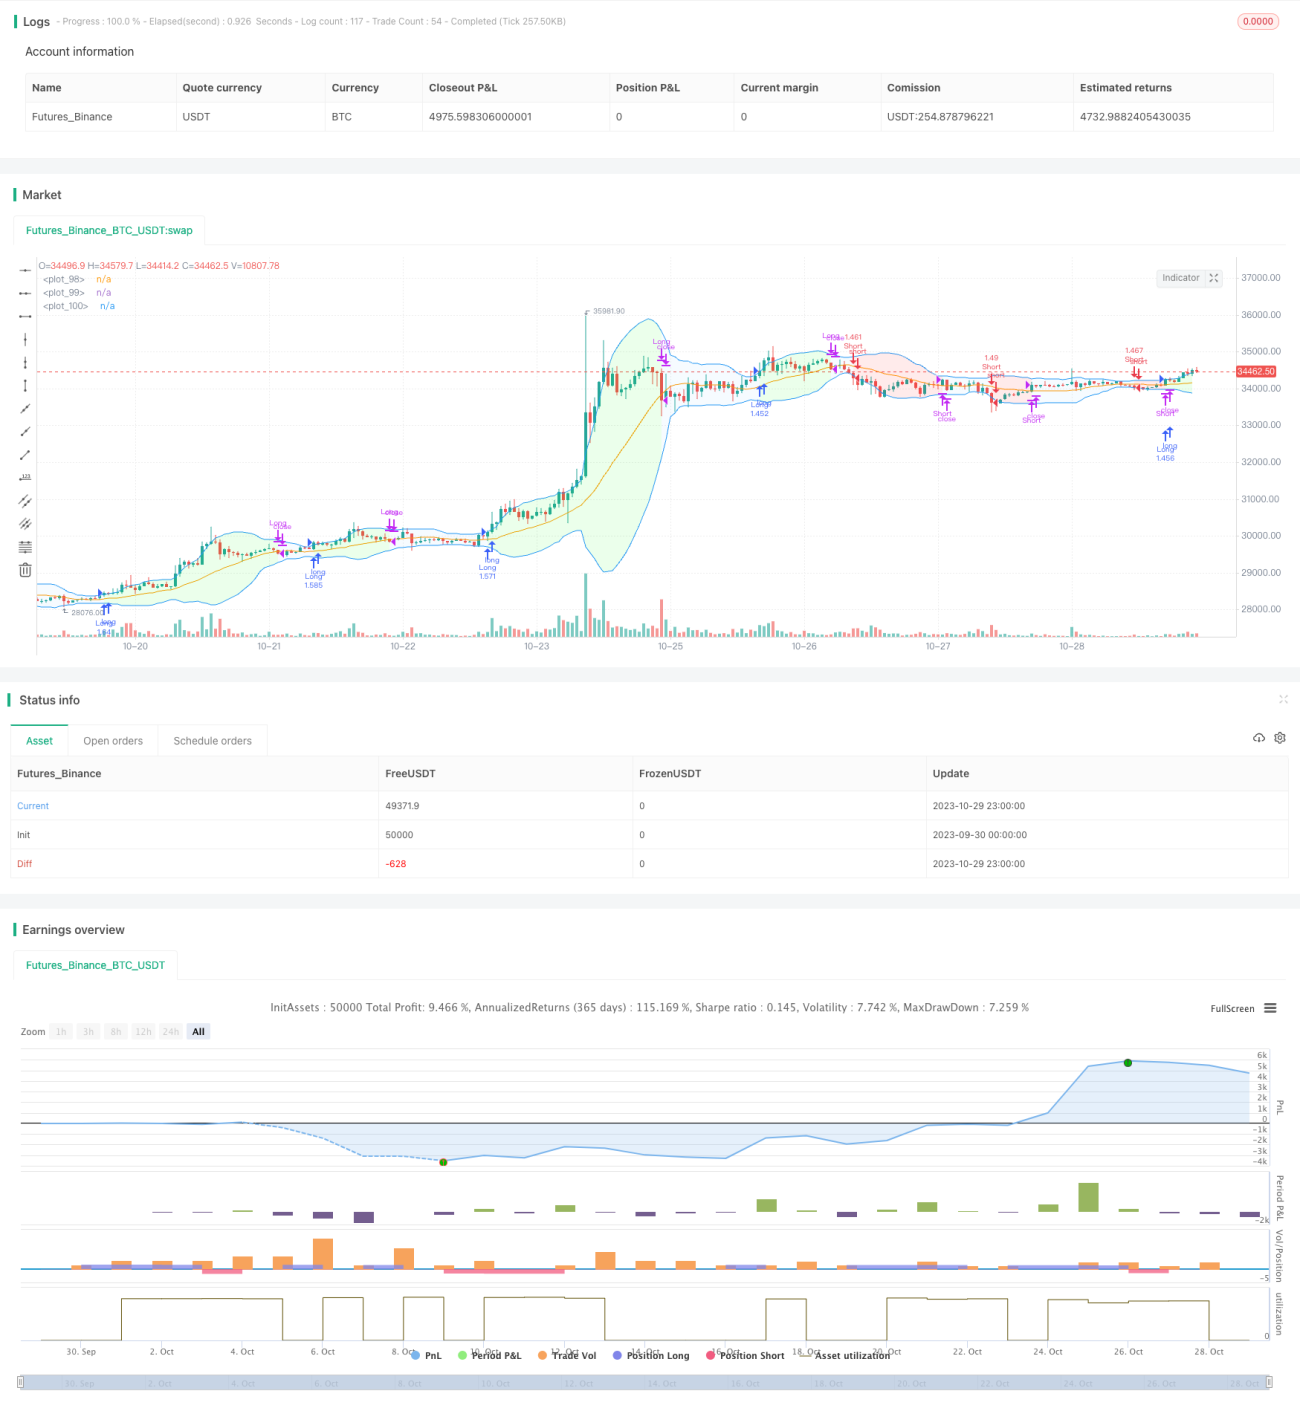
This is a reversal oscillation trend strategy based on Bollinger Bands channel. It uses Bollinger Bands upper and lower channel to determine trend, and looks for reversal opportunities when price approaches channel boundaries.

Strategy Logic

The strategy uses Bollinger Bands as the main technical indicator. Bollinger Bands consist of n-period moving average and upper/lower bands deviation. Upper band = n-period MA + m * n-period standard deviation, Lower band = n-period MA - m * n-period standard deviation. n and m are parameters.

When price approaches upper band, it indicates an uptrend but may reverse at peak. When price approaches lower band, it indicates a downtrend but may reverse at bottom. Effective breakout of Bollinger Bands may signal potential reversal.

The specific trading rules are:

  1. Go long when close > upper band, go short when close < lower band.

  2. Use n-period moving average as profit taking and stop loss signal. Close long when close breaks below MA, close short when close breaks above MA.

  3. Use fixed quantity for each trade.

  4. Use fixed fractional position sizing. Increase position size by fixed amount when meet fixed profit ratio, decrease size when loss.

Advantage Analysis

The advantages of this strategy:

  1. Using Bollinger Bands channel to determine trend direction and trade reversals, avoids most whipsaws and improves win rate.

  2. Moving average is a reliable profit taking/stop loss signal, locks in most profits.

  3. Fixed quantity is simple and easy to implement, no complex calculation needed.

  4. Fixed fractional position sizing expands profits while controls risk by position adjustment.

Risk Analysis

The risks of this strategy:

  1. Bollinger Bands may generate incorrect signals, causing losses trading against trend.

  2. Lagging of moving average may lead to insufficient profit taking.

  3. Fixed quantity cannot adapt to market conditions, risks of over/under position sizing.

  4. Aggressive position sizing adjustment in fixed fractional method may expand losses.

Solutions: Optimize Bollinger Bands parameters to improve signal accuracy. Add other indicators to determine trend. Reduce fixed quantity size. Lower position sizing adjustment ratio in fractional position sizing method.

Improvement Directions

The strategy can be improved from the following aspects:

  1. Optimize Bollinger Bands parameters like n and m to increase accuracy.

  2. Add other indicators like MACD, KD to avoid wrong signals.

  3. Change fixed quantity to dynamic positioning based on market conditions.

  4. Lower position sizing adjustment ratio in fractional position sizing to smooth equity curve.

  5. Add stop loss strategies like moving stop loss, breakout stop loss to control risk.

  6. Parameter optimization to find optimal parameter combinations.

Summary

In summary, this is a typical Bollinger Bands reversal strategy. It identifies reversal points by Bollinger Bands, sets profit taking/stop loss by moving average, controls risk by fixed quantity and fractional position sizing. As a reversal strategy, it theoretically avoids some whipsaws and improves profitability compared to traditional Bollinger Bands strategies. However, flaws in Bollinger Bands, moving averages require further optimization and risk management for robust practical application.


/*backtest
start: 2023-09-30 00:00:00
end: 2023-10-30 00:00:00
period: 1h
basePeriod: 15m
exchanges: [{"eid":"Futures_Binance","currency":"BTC_USDT"}]
*/

// This source code is subject to the terms of the Mozilla Public License 2.0 at https://mozilla.org/MPL/2.0/
// © gsanson66


//This strategy uses the well-known Bollinger Bands Indicator
//@version=5
strategy("BOLLINGER BANDS BACKTESTING", shorttitle="BB BACKTESTING", overlay=true, initial_capital=1000, default_qty_type=strategy.cash, default_qty_value=950, commission_type=strategy.commission.percent, commission_value=0.18)


//----------------------------------------FUNCTIONS---------------------------------------//

//@function Displays text passed to `txt` when called.
debugLabel(txt, color) =>
    label.new(bar_index, high, text = txt, color=color, style = label.style_label_lower_right, textcolor = color.black, size = size.small)

//@function which looks if the close date of the current bar falls inside the date range
inBacktestPeriod(start, end) => (time >= start) and (time <= end)


//---------------------------------------USER INPUTS--------------------------------------//

//Technical parameters
bbLength = input.int(defval=20, minval=1, title="BB Length", group="Technical Parameters")
mult = input.float(defval=2, minval=0.1, title="Standard Deviation Multipler", group="Technical Parameters")
smaLength = input.int(defval=20, minval=1, title="SMA Exit Signal Length", group="Technical Parameters")
//Money Management
fixedRatio = input.int(defval=400, minval=1, title="Fixed Ratio Value ($)", group="Money Management")
increasingOrderAmount = input.int(defval=200, minval=1, title="Increasing Order Amount ($)", group="Money Management")
//Backtesting period
startDate = input(title="Start Date", defval=timestamp("1 Jan 2020 00:00:00"), group="Backtesting Period")
endDate = input(title="End Date", defval=timestamp("1 July 2024 00:00:00"), group="Backtesting Period")


//----------------------------------VARIABLES INITIALISATION-----------------------------//
strategy.initial_capital = 50000
//Exit SMA
smaExit = ta.sma(close, smaLength)
//BB Calculation
basis = ta.sma(close, bbLength)
dev = mult * ta.stdev(close, bbLength)
upperBB = basis + dev
lowerBB = basis - dev
//Money management
equity = strategy.equity - strategy.openprofit
var float capital_ref = strategy.initial_capital
var float cashOrder = strategy.initial_capital * 0.95
//Backtesting period
bool inRange = na


//------------------------------CHECKING SOME CONDITIONS ON EACH SCRIPT EXECUTION-------------------------------//

//Checking if the date belong to the range
inRange := true

//Checking performances of the strategy
if equity > capital_ref + fixedRatio
    spread = (equity - capital_ref)/fixedRatio
    nb_level = int(spread)
    increasingOrder = nb_level * increasingOrderAmount
    cashOrder := cashOrder + increasingOrder
    capital_ref := capital_ref + nb_level*fixedRatio
if equity < capital_ref - fixedRatio
    spread = (capital_ref - equity)/fixedRatio
    nb_level = int(spread)
    decreasingOrder = nb_level * increasingOrderAmount
    cashOrder := cashOrder - decreasingOrder
    capital_ref := capital_ref - nb_level*fixedRatio

//Checking if we close all trades in case where we exit the backtesting period
if strategy.position_size!=0 and not inRange
    strategy.close_all()
    debugLabel("END OF BACKTESTING PERIOD : we close the trade", color=color.rgb(116, 116, 116))


//-----------------------------------EXIT SIGNAL------------------------------//

if strategy.position_size > 0 and close < smaExit
    strategy.close("Long")
if strategy.position_size < 0 and close > smaExit
    strategy.close("Short")


//----------------------------------LONG/SHORT CONDITION---------------------------//

//Long Condition
if close > upperBB and inRange
    qty = cashOrder/close
    strategy.entry("Long", strategy.long, qty)
//Short Condition
if close < lowerBB and inRange
    qty = cashOrder/close
    strategy.entry("Short", strategy.short, qty)


//---------------------------------PLOTTING ELEMENT----------------------------------//

plot(smaExit, color=color.orange)
upperBBPlot = plot(upperBB, color=color.blue)
lowerBBPlot = plot(lowerBB, color=color.blue)
fill(upperBBPlot, lowerBBPlot, title = "Background", color=strategy.position_size>0 ? color.rgb(0, 255, 0, 90) : strategy.position_size<0 ? color.rgb(255, 0, 0, 90) : color.rgb(33, 150, 243, 95))


More