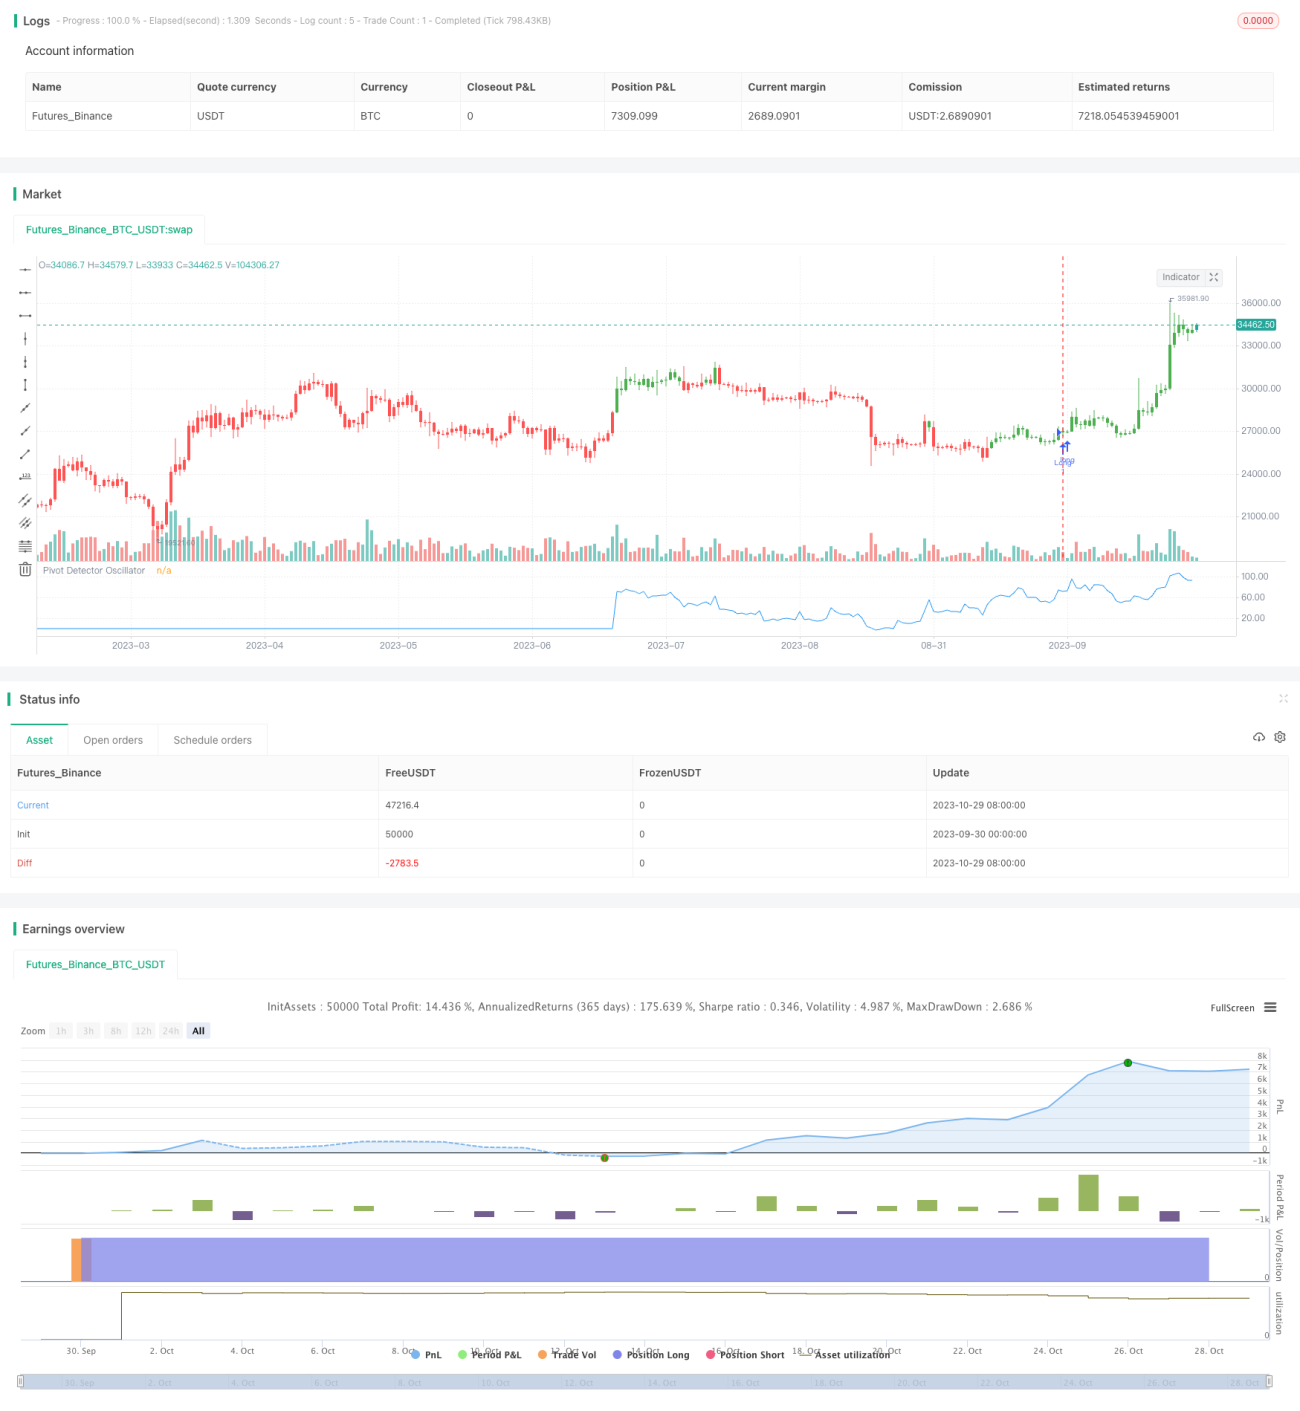
Pivot Detector Oscillator Trend Trading Strategy

Overview
This strategy is based on the Pivot Detector Oscillator to determine the current trend direction and manipulate the trend reversely using RSI to follow the trend.
Strategy Logic
This strategy uses SMA and RSI to construct the Pivot Detector Oscillator. The calculation method is as follows:
- Calculate N-day SMA
- Calculate M-day RSI
- When close price is above SMA, Pivot Detector Oscillator = (RSI - 35) / (85 - 35)
- When close price is below SMA, Pivot Detector Oscillator = (RSI - 20) / (70 - 20)
- Determine trend direction based on Pivot Detector Oscillator value
-
50 means bullish
- <50 means bearish
-
According to the Pivot Detector Oscillator signal, reverse manipulate the trend, i.e. go short when bullish and go long when bearish, to follow the trend direction.
The key of this strategy is using the Pivot Detector Oscillator to determine the trend direction and reverse manipulate to track the market trend.
Advantage Analysis
The main advantages of this strategy are:
-
The Pivot Detector Oscillator can accurately determine the trend direction. It comprehensively considers SMA and RSI, and can accurately identify trend reversal points.
-
The reverse manipulation strategy can effectively follow the trend. It can reverse operation in time when trend reversal happens to follow the trend.
-
The RSI parameter setting can adjust the sensitivity. Smaller RSI parameter makes it more sensitive to market changes.
-
The SMA period can be flexibly adjusted for trend analysis over different timeframes.
-
The long/short direction can be switched to adapt to different market conditions.
-
High capital utilization efficiency without requiring large capital.
Risk Analysis
There are also some risks:
-
Risk of misjudgment of the Pivot Detector Oscillator. Divergence may cause wrong judgments.
-
High risk of loss in reverse manipulation strategies. Strict stop loss is required.
-
Unable to reverse operation in time in strong trend conditions, potentially missing the trend.
-
Improper parameter settings may cause over-sensitivity or sluggishness.
-
Frequent trading leads to high transaction costs.
Risk management measures:
-
Set reasonable SMA period to avoid misjudgment.
-
Strict stop loss to control single loss.
-
Using partial position to reduce risk.
-
Parameter optimization to find optimal parameters.
-
Optimize stop loss strategy to reduce loss.
Improvement Directions
This strategy can be improved from the following aspects:
-
Optimize indicator parameters to find the optimal combination.
-
Optimize stop loss strategies such as trailing stop loss.
-
Add other indicators like MACD, KDJ to filter signals.
-
Use machine learning methods to automatically optimize, like evolutionary algorithms, reinforcement learning.
-
Combine volume analysis for timing.
-
Model-based stop loss based on price fluctuation models.
-
Optimize stop loss using high frequency data.
Summary
This strategy uses the Pivot Detector Oscillator to determine the trend direction and reverse manipulation to follow the trend. The advantages are accuracy, flexibility, high capital utilization efficiency, but there are also risks of misjudgment and loss. Further improvements on parameter optimization and stop loss can enhance profitability and stability. Overall this is a typical quantitative trading strategy with clear logic and worth in-depth researching.
/*backtest
start: 2023-09-30 00:00:00
end: 2023-10-30 00:00:00
period: 1d
basePeriod: 1h
exchanges: [{"eid":"Futures_Binance","currency":"BTC_USDT"}]
*/

//@version=2
////////////////////////////////////////////////////////////
//  Copyright by HPotter v1.0 03/10/2017
// The Pivot Detector Oscillator, by Giorgos E. Siligardos- 1