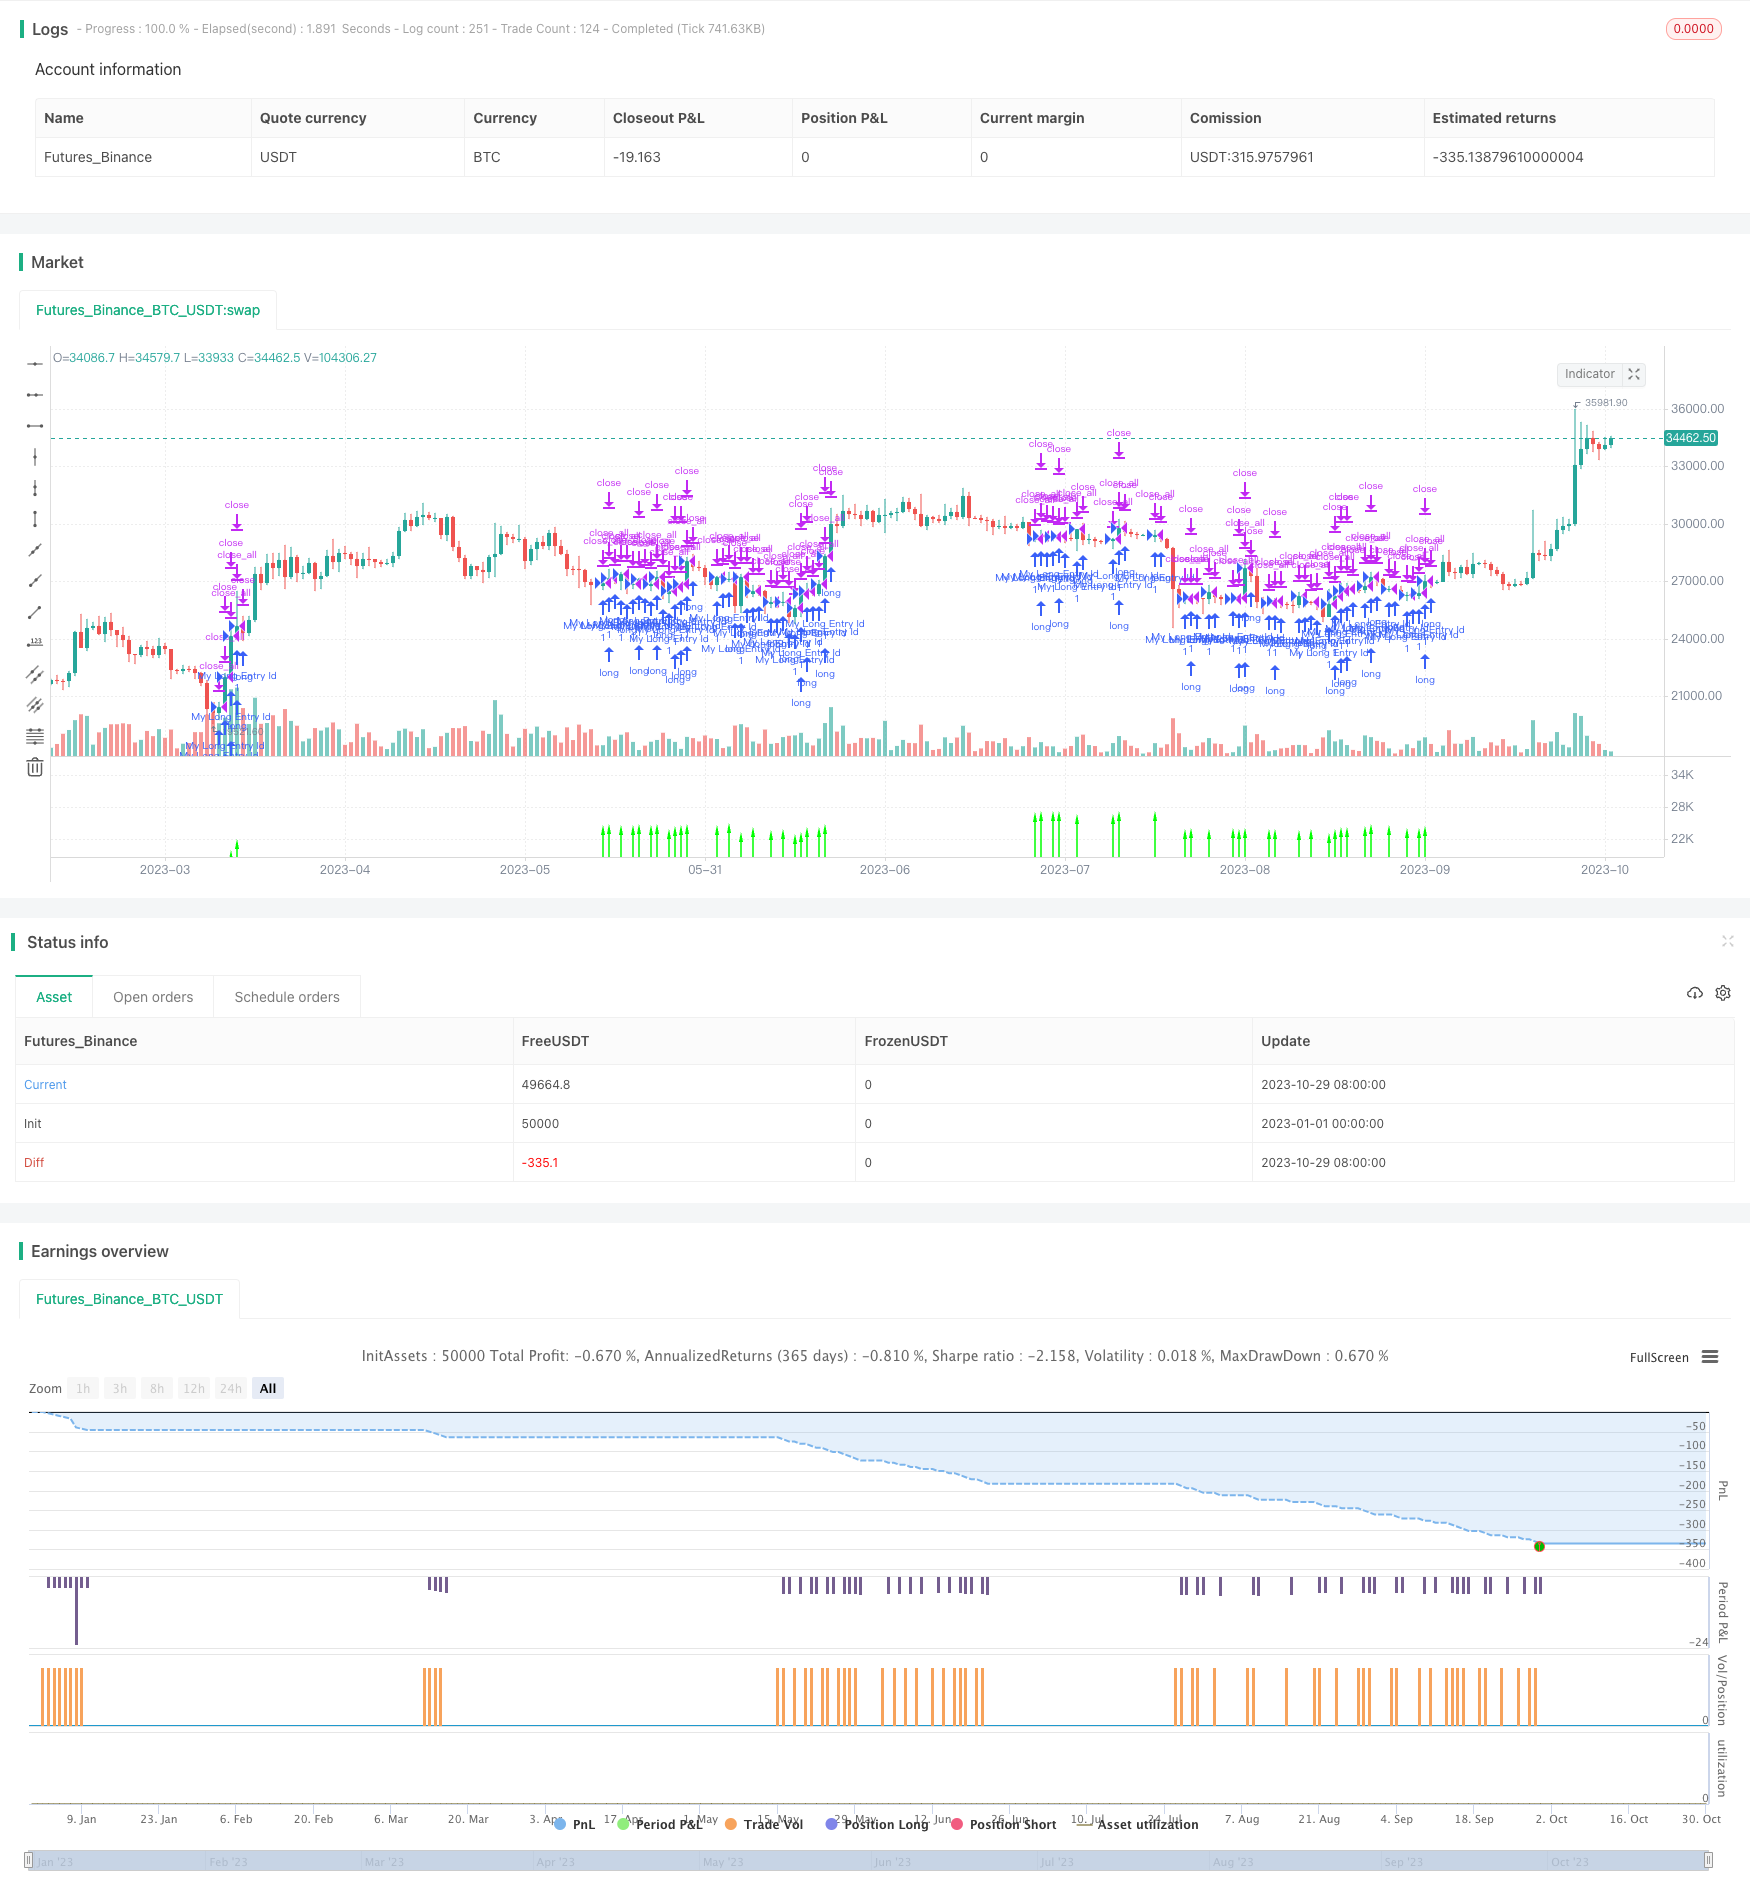
概述
该策略运用均线模型判断市场趋势方向,在看涨趋势时定期定额建仓做多,以追踪市场Golden交叉上涨趋势的策略。
策略原理
该策略主要基于以下几点技术原理:
使用EMA均线判断市场趋势方向。当快速EMA线上穿慢速EMA线时,判断为看涨趋势,做多方向准备入场。
结合MACD指标判断入场时点。当MACD指标由正转负时,说明买盘开始减弱,做多方向入场。
限制每个月只能入场一次,避免追高杀跌。每次入场的数量可以固定设置。
可以设置起始日期和结束日期,对回测周期进行限定。当回测结束时,策略会平掉所有头寸。
具体来说,该策略首先计算快速EMA线和慢速EMA线,并检测二者金叉关系来判断市场趋势。同时计算MACD指标判断具体入场点。在二者条件成立时产生做多信号,根据限定每个月只能入场一次的规则来确定实际发出入场指令。可以预先设置每次入场的资金量。在回测结束时,策略会主动平掉所有头寸。
策略优势
这是一个较为简单直接的趋势追踪策略,具有以下几点优势:
使用EMA均线判断大趋势方向简单实用。EMA均线对价格变化具有一定平滑作用,可以有效过滤震荡市场的噪声。
MACD指标可以较为精确地判定买盘结构转弱的时点,这样入场风险较小。
限制每个月只做一次追涨操作,可以避免在牛市中追高杀跌。
允许自定义每个月入场的资金量,可以根据自己的策略灵活调整仓位。
可以通过起始和结束日期进行回测检验,评估策略效果。
当回测结束时会主动平仓,可以避免模拟交易退出市场时仍持有仓位的尴尬。
风险及对策
该策略也存在一些潜在风险,主要包括:
依赖均线判断趋势的方法可能会漏掉短期调整中的机会,或在趋势反转时反应不够敏捷。可以适当缩短均线周期或增加其他判决指标进行优化。
每月只做一次追涨操作可能会错过较好的入场时点。可以考虑放宽入场频率或在突破新高时再追入一次。
存在一定的回测拟合风险。应增加参数调整空间,并做跨市场和跨时间周期的稳健性测试。
存在追涨杀跌和超买的风险。应适当控制每月入场资金额,避免仓位过大。
优化方向
这种定投追涨策略还可以从以下几个方面进行扩展和优化:
增加止损 EXIT 逻辑,在市场出现明显熊头的时候主动止损。
在 MACD 微笑准则成立时再追加一次买入,以获取更充分的涨势曝光。
引入当月新增高点与前月新增高点对比的多空力道判断,评估趋势是否仍然强劲。
增加仓位控制逻辑。每月入场资金额可以做比例控制,而不是固定值。
评估不同均线组合和MACD参数对策略效果的影响。寻找最佳参数组合。
增加一个trailing stop跟踪止损。在价格达到一个新高后开始以一定幅度跟踪,让利润继续运行。
总结
本策略整体作为一个简单的趋势追踪策略,核心思路清晰,易于实现,适合用来检验均线趋势跟踪和定投结合的效果。可以作为量化交易入门策略之一进行学习。但实盘中需要注意控制仓位规模,并继续对策略进行优化,使其可以适应更复杂的市场环境。
/*backtest
start: 2023-01-01 00:00:00
end: 2023-10-30 00:00:00
period: 1d
basePeriod: 1h
exchanges: [{"eid":"Futures_Binance","currency":"BTC_USDT"}]
*/

// This source code is subject to the terms of the Mozilla Public License 2.0 at https://mozilla.org/MPL/2.0/
// © runescapeyttanic

//@version=4
// strategy("Buy and Hold entry finder Strategy",pyramiding=10000, overlay=true,initial_capital=0,default_qty_type=strategy.cash,default_qty_value=1000,currency = currency.EUR,commission_type=strategy.commission.cash_per_order,commission_value=0)

//INPUTS##################################################################################################################

maxEmaDistance = input(title="Maximum EMA Distance", type=input.float, step=0.01, defval=50000)
emalength = input(title="EMA Length", type=input.integer,defval=200)

// Make input options that configure backtest date range
startDate = input(title="Start Date", type=input.integer,
     defval=1, minval=1, maxval=31)
startMonth = input(title="Start Month", type=input.integer,
     defval=1, minval=1, maxval=12)
startYear = input(title="Start Year", type=input.integer,
     defval=2020, minval=1800, maxval=2100)

endDate = input(title="End Date", type=input.integer,
     defval=12, minval=1, maxval=31)
endMonth = input(title="End Month", type=input.integer,
     defval=02, minval=1, maxval=12)
endYear = input(title="End Year", type=input.integer,
     defval=2021, minval=1800, maxval=2100)

endDate1=endDate-1
//starttag
//startmonat
//MACD########################################################################################################################

fast_length=12
slow_length=26
src=close
col_macd=#0094ff
fast_ma = ema(src, fast_length)
slow_ma = ema(src, slow_length)
macd = fast_ma - slow_ma

//EMA Distance CALC########################################################################################################

ma1 =ema(close,emalength)
distFromMean = close - ma1

inDateRange = true

longCondition = (distFromMean<=maxEmaDistance and distFromMean>=distFromMean[1] and macd<=0 and inDateRange)
longnow=false

if(longCondition and strategy.position_size == 0)
    strategy.entry("My Long Entry Id", strategy.long)
    longnow:=true

if(longCondition and strategy.position_size > 0)
    longnow:=true


if(longCondition and strategy.position_size > 0 and month>valuewhen(longnow, month ,1) or longCondition and strategy.position_size > 0 and year>valuewhen(longnow, year ,1) and inDateRange)
    strategy.entry("My Long Entry Id", strategy.long)

plotchar(minute, "Minuten", "", location = location.top)

plotchar(hour, "Stunden", "", location = location.top)

plotchar(dayofmonth, "Tage", "", location = location.top)

plotchar(month, "Monat", "", location = location.top)

plotchar(year, "Jahr", "", location = location.top)

plotchar(strategy.position_size, "Positionen", "", location = location.top)

plotchar(longCondition, "Long Condition", "", location = location.top)

if true
    strategy.close_all()

//#########################################################################################################################

plotArrow = if (distFromMean<=maxEmaDistance and distFromMean>=distFromMean[1] and macd<=0)
    1
else
    0

plotarrow(series=plotArrow)