Rose Cross Star Dual Indicator Volatility Strategy

Overview
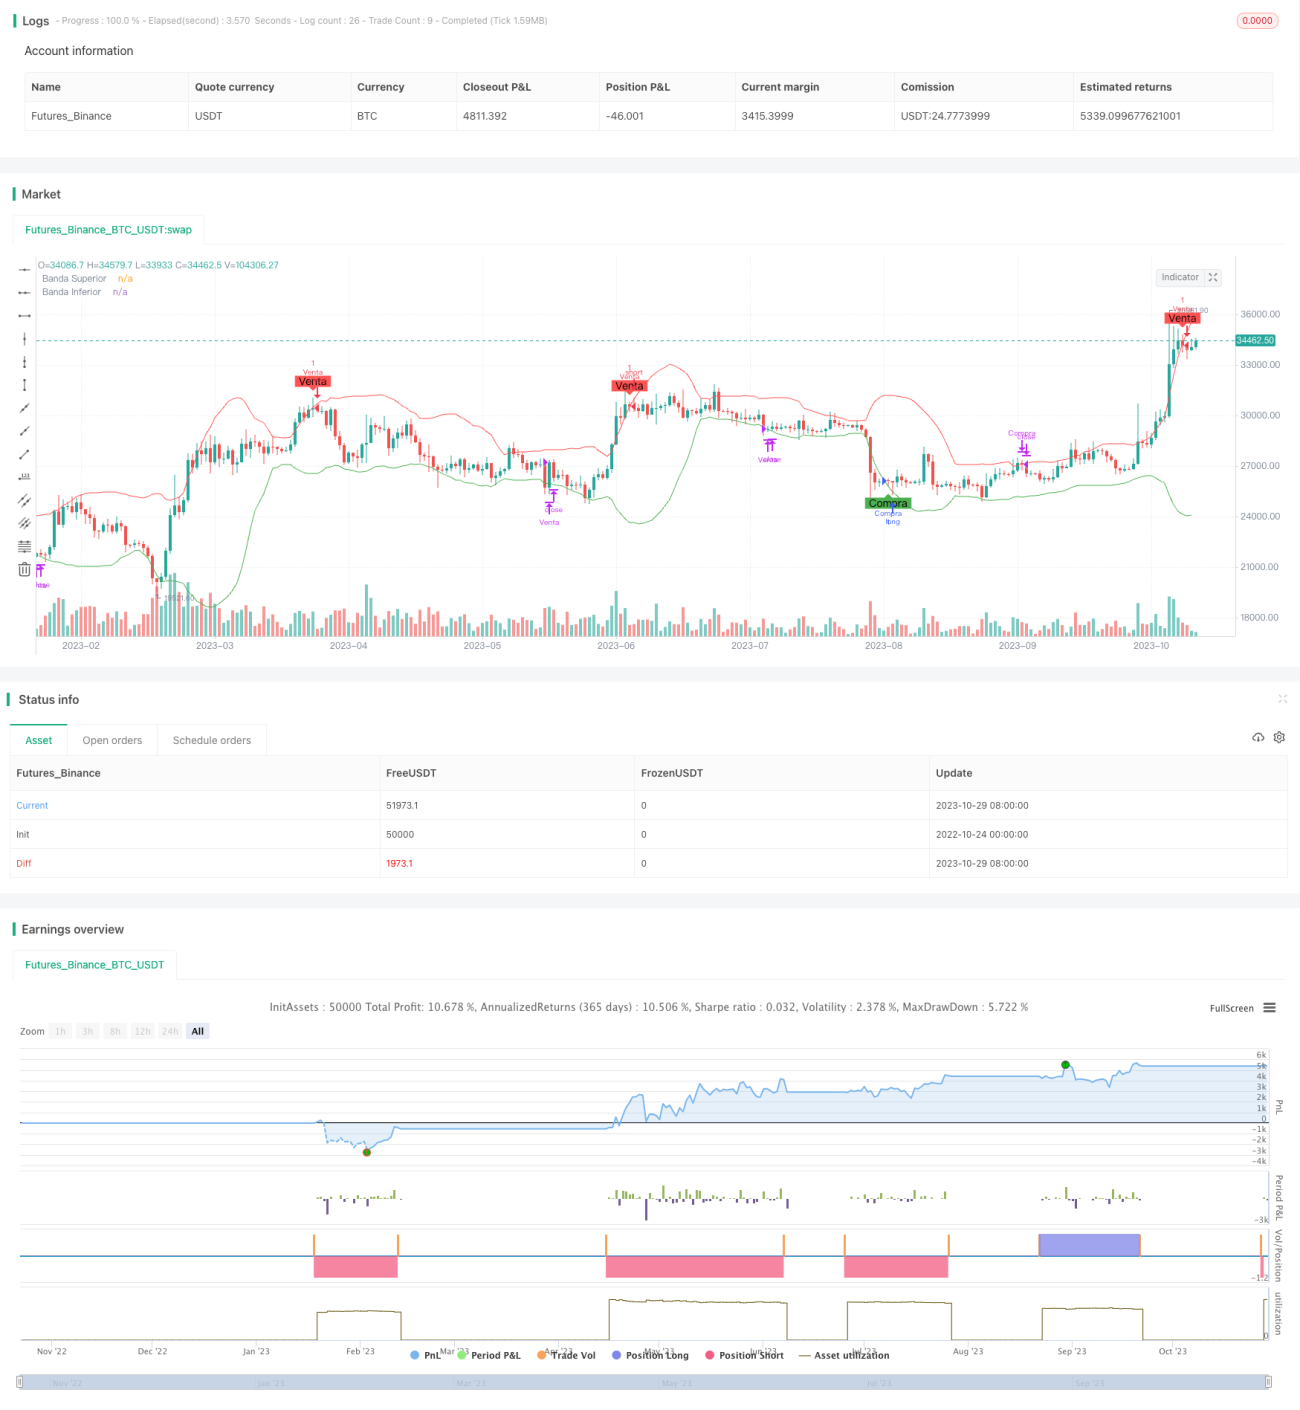
This strategy identifies trading opportunities through combining Bollinger Bands and a modified Relative Strength Index (RSI). Backtest results demonstrate its overall profitability and high winning rate. It captures breakout signals in trending markets and suits short-term to medium-term trading.
Strategy Logic
Indicator Selection
The strategy utilizes Bollinger Bands with a standard deviation multiplier of 2 and RSI with a period of 14. Bollinger Bands detect breakouts and RSI determines overbought/oversold levels. Indicator parameters are set based on experience and iterative testing.
Entry Rules
-
Go long when price breaks above the lower Bollinger Band and RSI is below 30 (oversold zone).
-
Go short when price breaks below the upper Bollinger Band and RSI is above 70 (overbought zone).
Exit Rules
-
Close long positions on a stop loss or when price breaks below the upper Bollinger Band.
-
Close short positions on a stop loss or when price breaks above the lower Bollinger Band.
Advantages
-
Dual indicator combination improves strategy precision.
-
Optimized indicator parameters provide robust adaptability.
-
Breakout signals are clear and easy to implement.
-
Effective drawdown and loss control.
-
Visual signals simplify trade execution.
Risks
-
Band squeeze may cause false breakouts. Consider longer Bollinger periods.
-
Frequent trading possible in range-bound markets. Lower RSI sensitivity.
-
Manage transaction costs. Widen stop distances.
Enhancements
-
Test EMA and other indicators to generate bands.
-
Add volume or MA filters to avoid false breaks.
-
Set band and stop distances based on ATR.
-
Add trend filter to reduce whipsaws.
Conclusion
This strategy combines the strengths of Bollinger Bands and RSI for trend and breakout trading. Simple to implement, it is well-suited for short to medium-term breakouts. Extensions through indicator and parameter optimization can further expand its robustness.
/*backtest
start: 2022-10-24 00:00:00
end: 2023-10-30 00:00:00
period: 1d
basePeriod: 1h
exchanges: [{"eid":"Futures_Binance","currency":"BTC_USDT"}]
*/

//@version=4
strategy("Estrategia de Ruptura con Bollinger y RSI Modificada", shorttitle="BB RSI Mod", overlay=true)

// Parámetros de Bollinger Bands- 1