trend following strategy based on Donchian Channels

Overview
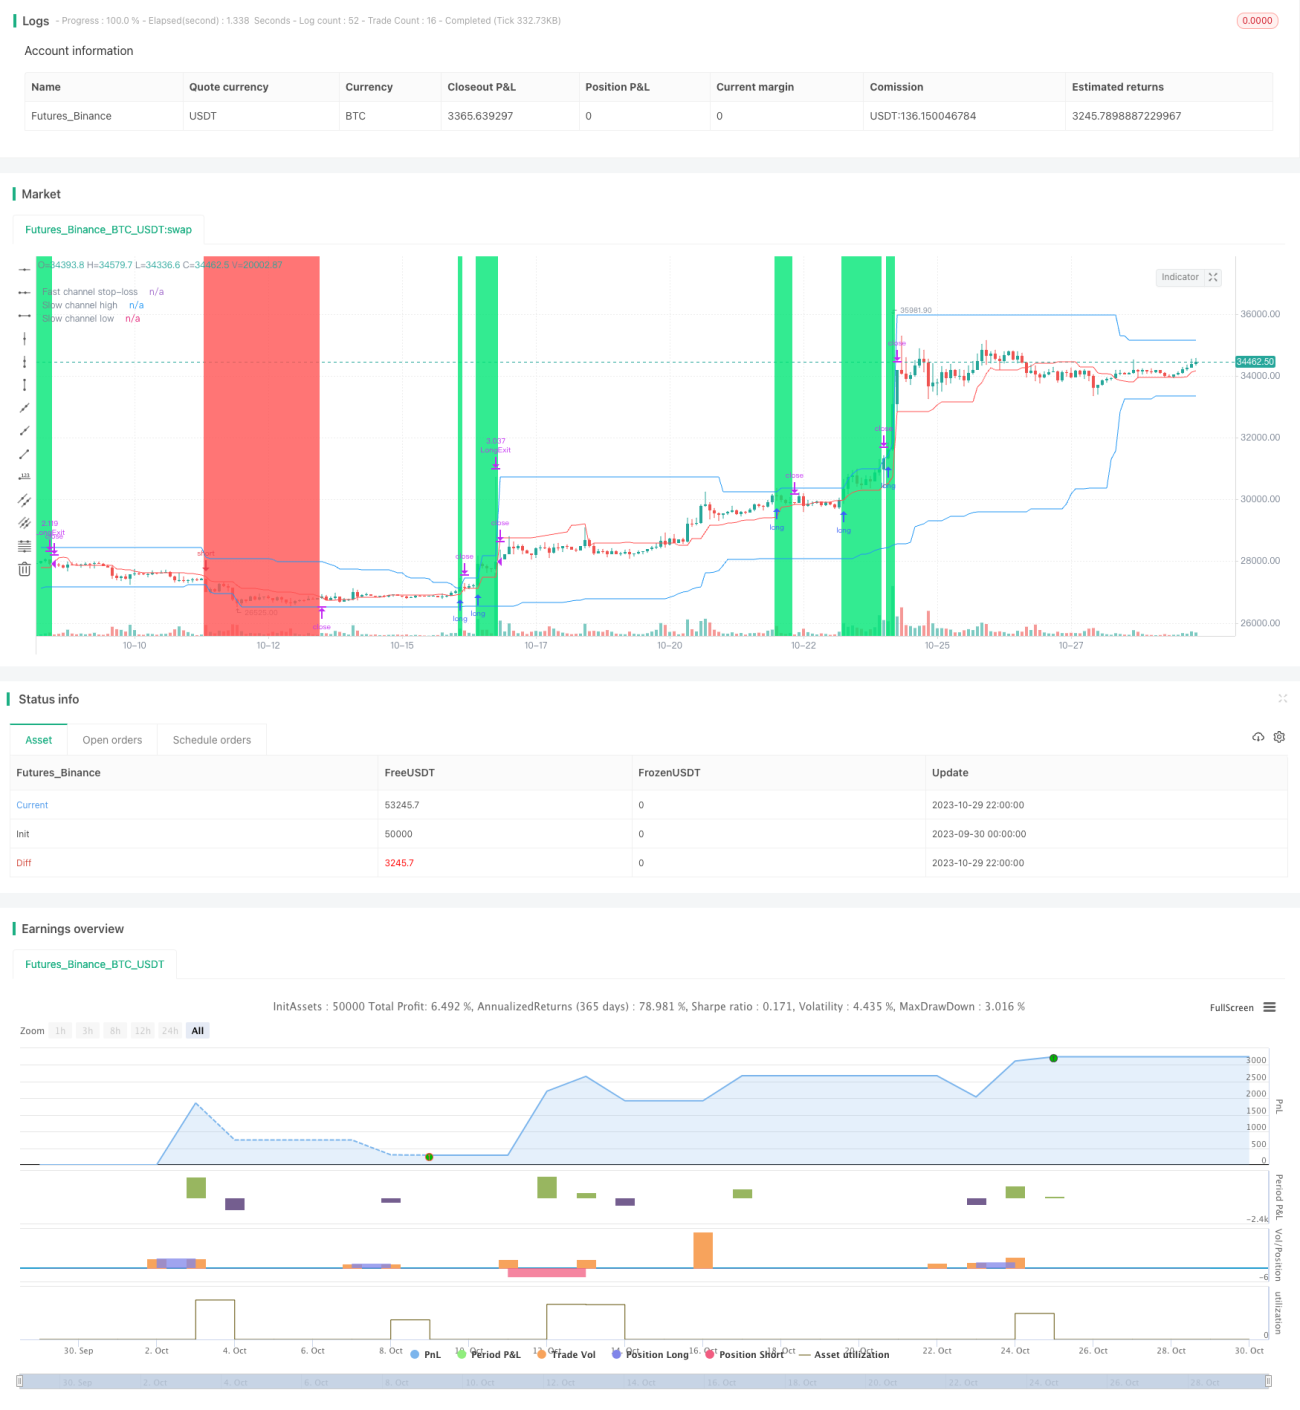
The Puling strategy is a trend following strategy based on Donchian Channels. It uses fast and slow Donchian Channels to identify the trend direction and enter on pullbacks. The advantages of this strategy are that it can track trends automatically and cut losses in time when the trend changes. But it also has the risks of drawdown and stop loss being too close.
Strategy Logic
The strategy first defines the fast channel period as 20 bars, and the slow channel period as 50 bars. The fast channel is used to set the stop loss price, while the slow channel is used to determine the trend direction and entry timing.
First, the highest high and lowest low of the fast channel are calculated, and the midpoint is taken as the stop loss line. At the same time, the highest high and lowest low of the slow channel are calculated, and the channel top and bottom are used as the entry lines.
When the price breaks through the top of the slow channel, go long. When the price breaks through the bottom of the slow channel, go short. After entering the position, set the stop loss at the midpoint of the fast channel.
So the slow channel determines the major trend direction, while the fast channel tracks minor breakouts within a small range to determine the stop loss point. When the major trend reverses, the price will first break through the stop loss line of the fast channel to realize the stop loss.
Advantages
-
Automatically track trends and cut losses in time. The double channel structure can automatically track trends and quickly cut losses when trends reverse.
-
Enter on pullbacks, with some trend filtering effect. Only taking entries when price breaks through channel boundaries can filter out some false breakouts without real trend.
-
Controllable risk. The close stop loss distance can control single loss.
Risks
-
Larger drawdowns. Trend following strategies can have relatively large drawdowns which requires psychological preparation.
-
Stop loss too close. The fast channel period is short so the stop loss is close, prone to being stopped out. We can appropriately relax the fast channel period.
-
Too many trades. The double channel structure can generate excessive entries, requiring reasonable position sizing.
Optimization Directions
-
Add entry filters. We can add volatility etc. in entry conditions to filter breakouts without enough trend strength.
-
Optimize channel period parameters. We can find the optimal channel parameter combinations systematically.
-
Combining multiple timeframes. Determine the major trend on higher timeframes and trade on lower timeframes.
-
Dynamic stop loss distance. Adjust stop distance dynamically based on market volatility.
Summary
The Puling strategy is a standard trend following strategy overall. It uses price channels to determine trend direction and sets stop loss to control risks. The strategy has some advantages but also the problems of drawdown and stop loss being too close. We can optimize it through adjusting channel parameters, adding filters etc. But we should note trend following strategies require strong psychology to endure drawdowns.
- 1