概述
该策略基于超越指标(SMI)和悟道线(Ergotic Line)构建了一个趋势跟踪系统,结合快速移动均线和慢速移动均线形成买卖信号,属于频繁交易的动量系统策略。
策略原理
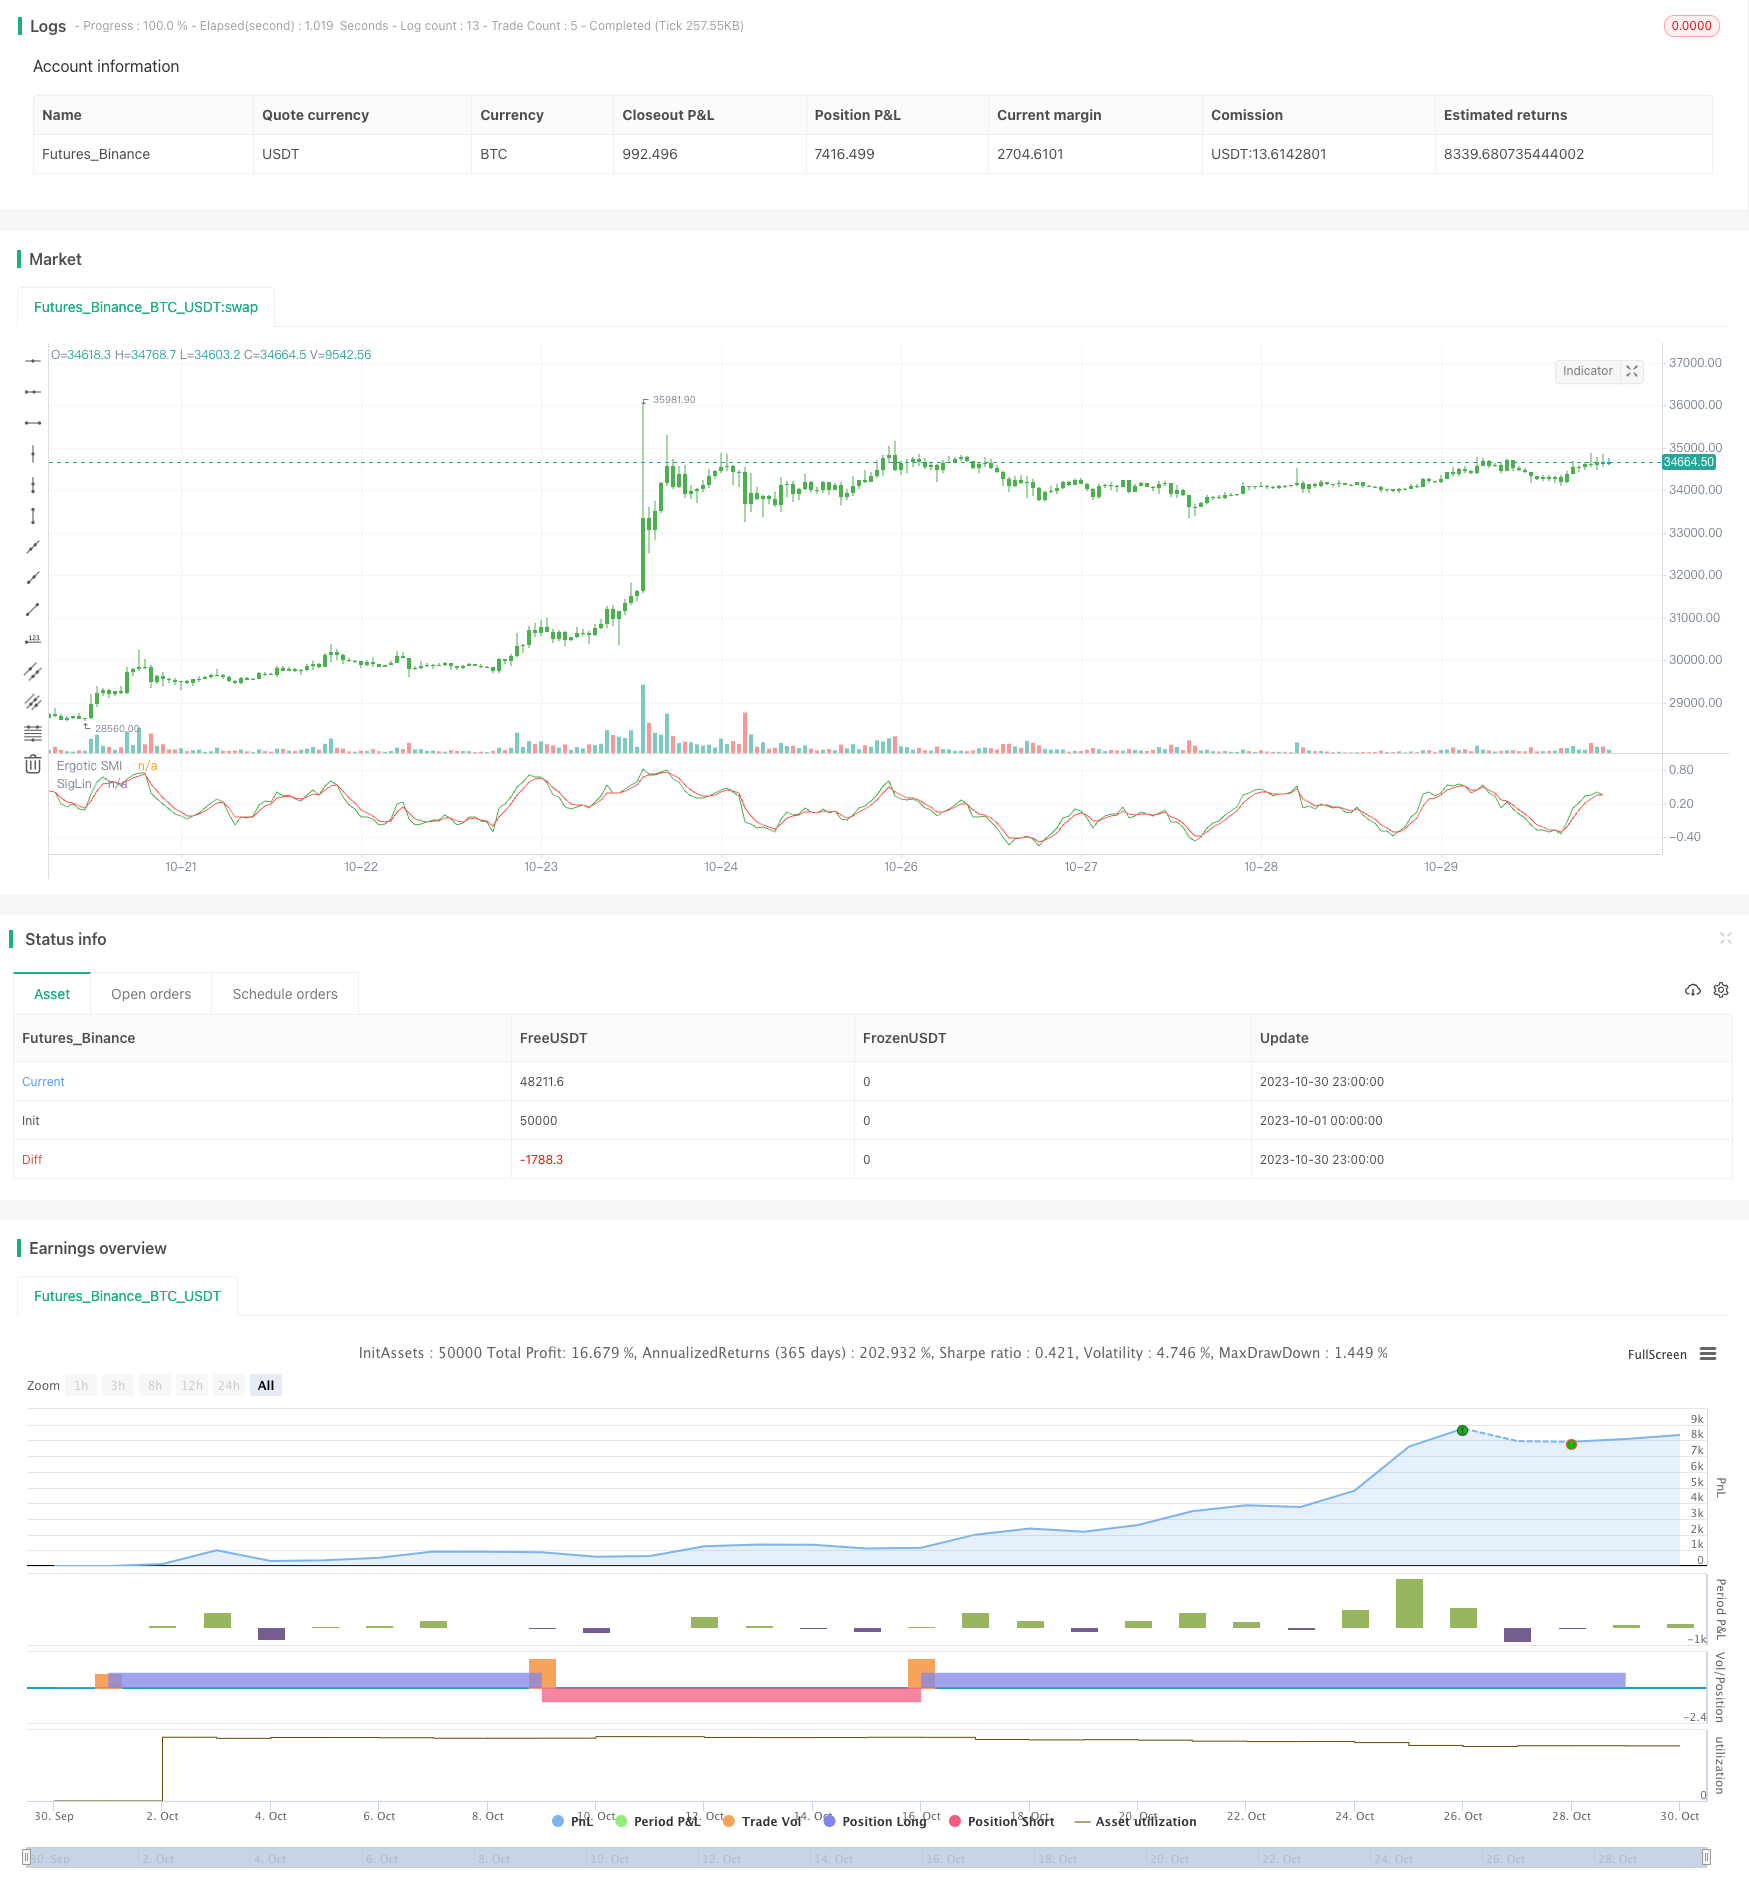
该策略主要是基于超越指标(SMI)和悟道线(Ergotic Line)来构建交易信号。
超越指标(SMI)是根据价格的变动速度进行计算,通过两个不同周期的指数移动平均线之差除以绝对差值来计算。其计算公式为:
SMI = (Fast EMA - Slow EMA) / Abs(Fast EMA - Slow EMA)
其中,Fast EMA是短周期的指数移动平均线,Slow EMA是长周期的指数移动平均线。
通过计算价格变动的速度快慢,SMI可以判断市场趋势的变化。当SMI上穿0时为看涨信号,反之为看跌信号。
悟道线(Ergotic Line)是SMI的指数移动平均线,可以用来产生交易信号。当SMI上穿悟道线时为买入信号,SMI下穿悟道线时为卖出信号。
该策略通过SMI和悟道线的组合,形成了一个无滞后的趋势跟踪系统,属于频繁交易的动量系统策略。
策略优势
基于价格变动速度的趋势判断,对趋势变化敏感;
悟道线过滤SMI指标的假信号,形成较为可靠的交易信号;
采用双轨道结构,买卖信号明确;
交易频繁,能捕捉趋势内的较快价格变动。
无滞后,能及时捕捉转折点。
策略风险
作为动量系统,在震荡行情中存在大量止损的风险;
双轨道设置不当可能导致信号频繁,造成过度交易;
短周期参数设置不当,可能产生大量假信号;
没有考虑大级别趋势方向,可能逆势操作。
需严格遵守止损规则,否则亏损可能加剧。
针对风险,可以考虑优化如下方面:
优化双轨道参数,降低假信号概率;
结合趋势过滤,避免逆势;
加入止损策略,控制单笔亏损。
策略优化方向
该策略可以从以下几个方面进行优化:
优化快慢均线参数,寻找最优参数组合;
测试不同的价格输入,如开盘价,最高价,最低价等;
加入机器学习算法,对参数进行自动优化;
结合趋势指标进行过滤,避免逆势交易;
增加止损策略,严格控制单笔亏损;
考虑交易次数或盈亏比等因素,避免过度交易;
测试不同品种的适用性,寻找最佳品种。
探索与其他指标的组合,形成更完善的交易系统。
总结
该策略基于超越指标和悟道线构建了一个无滞后的趋势跟踪系统,通过双轨道形成清晰的交易信号,属于频繁交易的动量策略。优点是捕捉趋势变化迅速,缺点是容易造成过度交易和逆势交易。我们可以通过参数优化、止损策略、趋势过滤等方式进行改进,将其打造成一个更完善的量化交易系统。
/*backtest
start: 2023-10-01 00:00:00
end: 2023-10-31 00:00:00
period: 1h
basePeriod: 15m
exchanges: [{"eid":"Futures_Binance","currency":"BTC_USDT"}]
*/

//@version=2
////////////////////////////////////////////////////////////
//  Copyright by HPotter v1.0 03/11/2017
// The SMI Ergodic Indicator is the same as the True Strength Index (TSI) developed by
// William Blau, except the SMI includes a signal line. The SMI uses double moving averages
// of price minus previous price over 2 time frames. The signal line, which is an EMA of the
// SMI, is plotted to help trigger trading signals. Adjustable guides are also given to fine
// tune these signals. The user may change the input (close), method (EMA), period lengths
// and guide values.
// You can use in the xPrice any series: Open, High, Low, Close, HL2, HLC3, OHLC4 and ect...
//
// You can change long to short in the Input Settings
// WARNING:
// - For purpose educate only
// - This script to change bars colors.
////////////////////////////////////////////////////////////
strategy(title="SMI Ergodic Oscillator")
fastPeriod = input(4, minval=1)
slowPeriod = input(8, minval=1)
SmthLen = input(3, minval=1)
TopBand = input(0.5, step=0.1)
LowBand = input(-0.5, step=0.1)
reverse = input(false, title="Trade reverse")
// hline(0, color=gray, linestyle=dashed)
// hline(TopBand, color=red, linestyle=line)
// hline(LowBand, color=green, linestyle=line)
xPrice = close
xPrice1 = xPrice - xPrice[1]
xPrice2 = abs(xPrice - xPrice[1])
xSMA_R = ema(ema(xPrice1,fastPeriod),slowPeriod)
xSMA_aR = ema(ema(xPrice2, fastPeriod),slowPeriod)
xSMI = xSMA_R / xSMA_aR
xEMA_SMI = ema(xSMI, SmthLen)
pos = iff(xEMA_SMI < LowBand, -1,
	   iff(xEMA_SMI > TopBand, 1, nz(pos[1], 0)))
possig = iff(reverse and pos == 1, -1,
          iff(reverse and pos == -1, 1, pos))
if (possig == 1)
    strategy.entry("Long", strategy.long)
if (possig == -1)
    strategy.entry("Short", strategy.short)
barcolor(possig == -1 ? red: possig == 1 ? green : blue )
plot(xSMI, color=green, title="Ergotic SMI")
plot(xEMA_SMI, color=red, title="SigLin")