Schaff Trend Cycle Momentum Following Strategy

1
Follow
1779
Followers
Overview
This strategy is based on the Schaff Trend Cycle indicator, combined with the overbought and oversold principles of the Stoch RSI, to determine and follow trends using momentum metrics. It goes long when the price breaks out of the oversold region into the overbought region, and goes short when the price breaks down from the overbought region into the oversold region. The strategy dynamically adjusts positions by capturing changes in price trends.
Strategy Logic
-
- Calculate the MACD, where the default Fast Length is 23 and Slow Length is 50. MACD reflects the difference between short and long term moving averages to judge price momentum.
-
- Apply Stoch RSI to the MACD to form the K value, where the default Cycle Length is 10, reflecting overbought/oversold levels of the MACD momentum metric.
-
- Take the weighted moving average of K to form D, where the default 1st %D Length is 3, to remove noise from K.
-
- Apply Stoch RSI again to D to form the initial STC value, where the default 2nd %D Length is 3, to create precise overbought/oversold signals.
-
- Take the weighted moving average of the initial STC to get the final STC value, ranging from 0-100. STC above 75 is overbought, below 25 oversold.
-
- Go long when STC crosses above 25 upwards, and short when STC crosses downwards past 75.
Advantages
-
- STC's design combining Stoch RSI clearly identifies overbought/oversold regions, forming strong trend signals.
-
- The double Stoch RSI filtering effectively removes false breakouts.
-
- STC's standardized 0-100 range allows straightforward mechanized trade signals.
-
- The backtest implements visual breakout markings and text popup alerts for clear and intuitive signal capturing.
-
- Optimized default parameters avoid oversensitive signals and needless trades.
Risks
-
- STC is parameter sensitive. Different coins and timeframes require parameter tuning to suit market characteristics.
-
- Breakout strategies are prone to traps, requiring stops to control risk.
-
- Low liquidity false breakouts may generate bad signals, needing volume filter.
-
- STC alone risks reversals. Confirmation using other factors is needed.
-
- Key support/resistance levels should be watched to avoid bad signals.
Enhancement Opportunities
-
- Optimize MACD parameters for different periods and coins.
-
- Refine Stoch RSI K and D values to smooth STC curve.
-
- Add volume filter to avoid low liquidity false breakouts.
-
- Incorporate additional indicators to confirm signals, e.g. Bollinger Bands.
-
- Add stop mechanisms like moving/ATR stops.
-
- Adjust entry, e.g. enter on pullback after breakout for trend confirmation.
Conclusion
The Schaff Trend Cycle strategy identifies overbought/oversold via momentum metrics to determine short-term price trend changes. Though simple and adjustable, it risks traps. Confirmation and stops aid optimization for strong trends.
Source
Pine
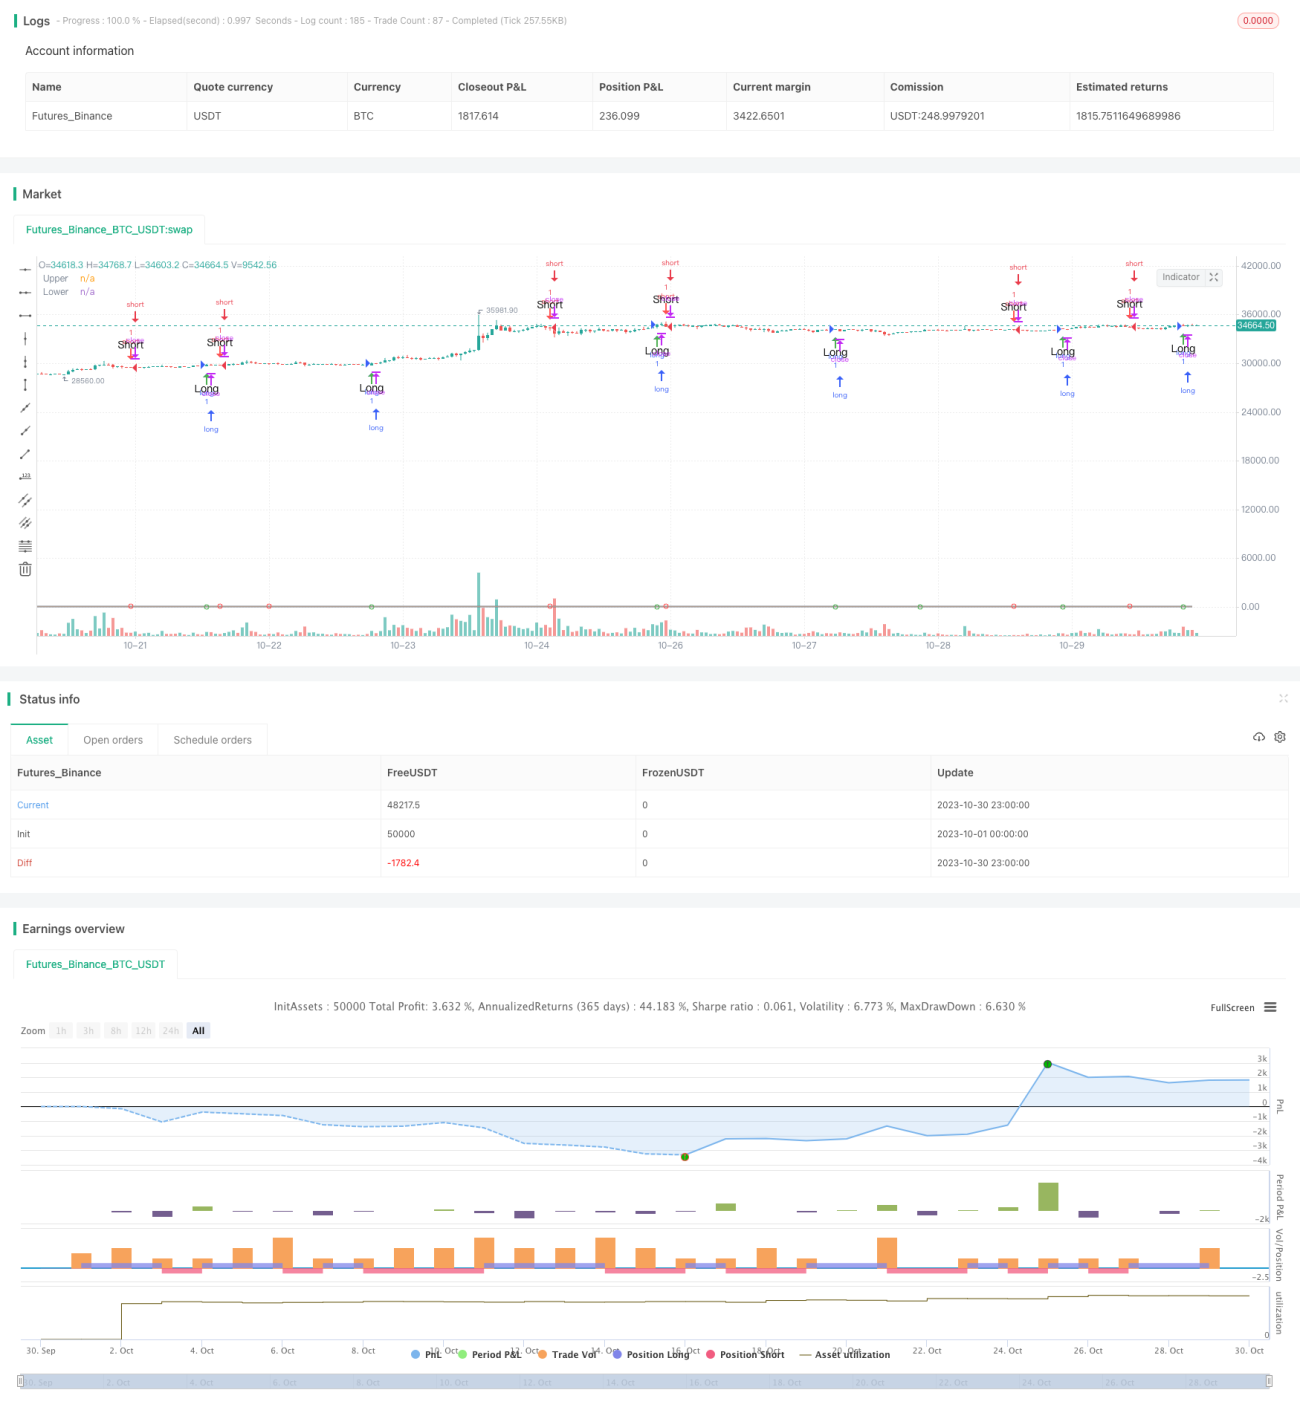
/*backtest
start: 2023-10-01 00:00:00
end: 2023-10-31 00:00:00
period: 1h
basePeriod: 15m
exchanges: [{"eid":"Futures_Binance","currency":"BTC_USDT"}]
*/

//@version=3
// Copyright (c) 2018-present, Alex Orekhov (everget)
// Schaff Trend Cycle script may be freely distributed under the MIT license.
strategy("Schaff Trend Cycle", shorttitle="STC Backtest", overlay=true)Strategy parameters
Related strategies
Comment
All comments (0)
No data
- 1