RSI Mean Reversion Trading Strategy

Overview
This strategy uses the RSI indicator to identify trends and overbought/oversold conditions. Combined with EMA to determine current trend direction, it opens reverse positions when the trend direction is consistent with RSI signals to implement mean reversion trading.
Strategy Logic
-
Use EMA indicator to determine current trend direction. Above EMA defines an uptrend while below EMA defines a downtrend.
-
Use RSI indicator to identify overbought/oversold conditions. RSI above 60 is overbought zone and below 40 is oversold zone.
-
When uptrend and RSI below 40, a buy signal is triggered. When downtrend and RSI above 60, a sell signal is triggered.
-
When buy/sell signals triggered, take profit and stop loss prices are set based on certain percentage of entry price.
-
When position size greater than 0, take profit order is placed. When position size less than 0, stop loss order is placed.
Advantage Analysis
-
The strategy reasonably combines EMA and RSI to identify trends and overbought/oversold conditions, avoiding trading against trends.
-
The mean reversion approach catches short-term rotations for profits.
-
Take profit and stop loss points help lock in profits and control risks.
-
Simple and clear logic, easy to understand and implement, suitable for beginners.
-
Parameters like EMA period and RSI can be optimized for different products and market environments.
Risk Analysis
-
Failed reversal risk. Short-term reversal may fail, resulting in losses.
-
Unclear trend risk. EMA may fail to identify a clear trend in ranging markets, generating wrong signals.
-
Stop loss triggered risk. Stop loss set too close may be unexpectedly triggered.
-
Overfitting risk. Excessive optimization on historical data may not apply for live trading.
-
High trading frequency risk. Too frequent trading incurs significant transaction costs.
Improvement
-
Optimize EMA and RSI parameters to find best combination through backtesting.
-
Add filters to avoid wrong signals in ranging market. For example, add volume condition.
-
Optimize take profit/stop loss ratio to lock in profits. Stop loss should not be too wide.
-
Add position sizing rules like fixed fraction to control single trade loss.
-
Combine other indicators like MACD, KD to improve signal accuracy or use multivariate models.
-
Backtest on live data and continuously optimize for latest market conditions.
Conclusion
This strategy implements a short-term mean reversion approach based on EMA and RSI, with clear logic of trend identification and overbought/oversold detection. It sets take profit and stop loss to control risks while profiting from short-term rotations. The simplicity and clarity are its advantages. Further optimizations can yield good backtest results. But risks like failed reversal and ranging market should be noted for live trading. Overall it provides a simple and practical short-term trading idea for beginners to learn from.
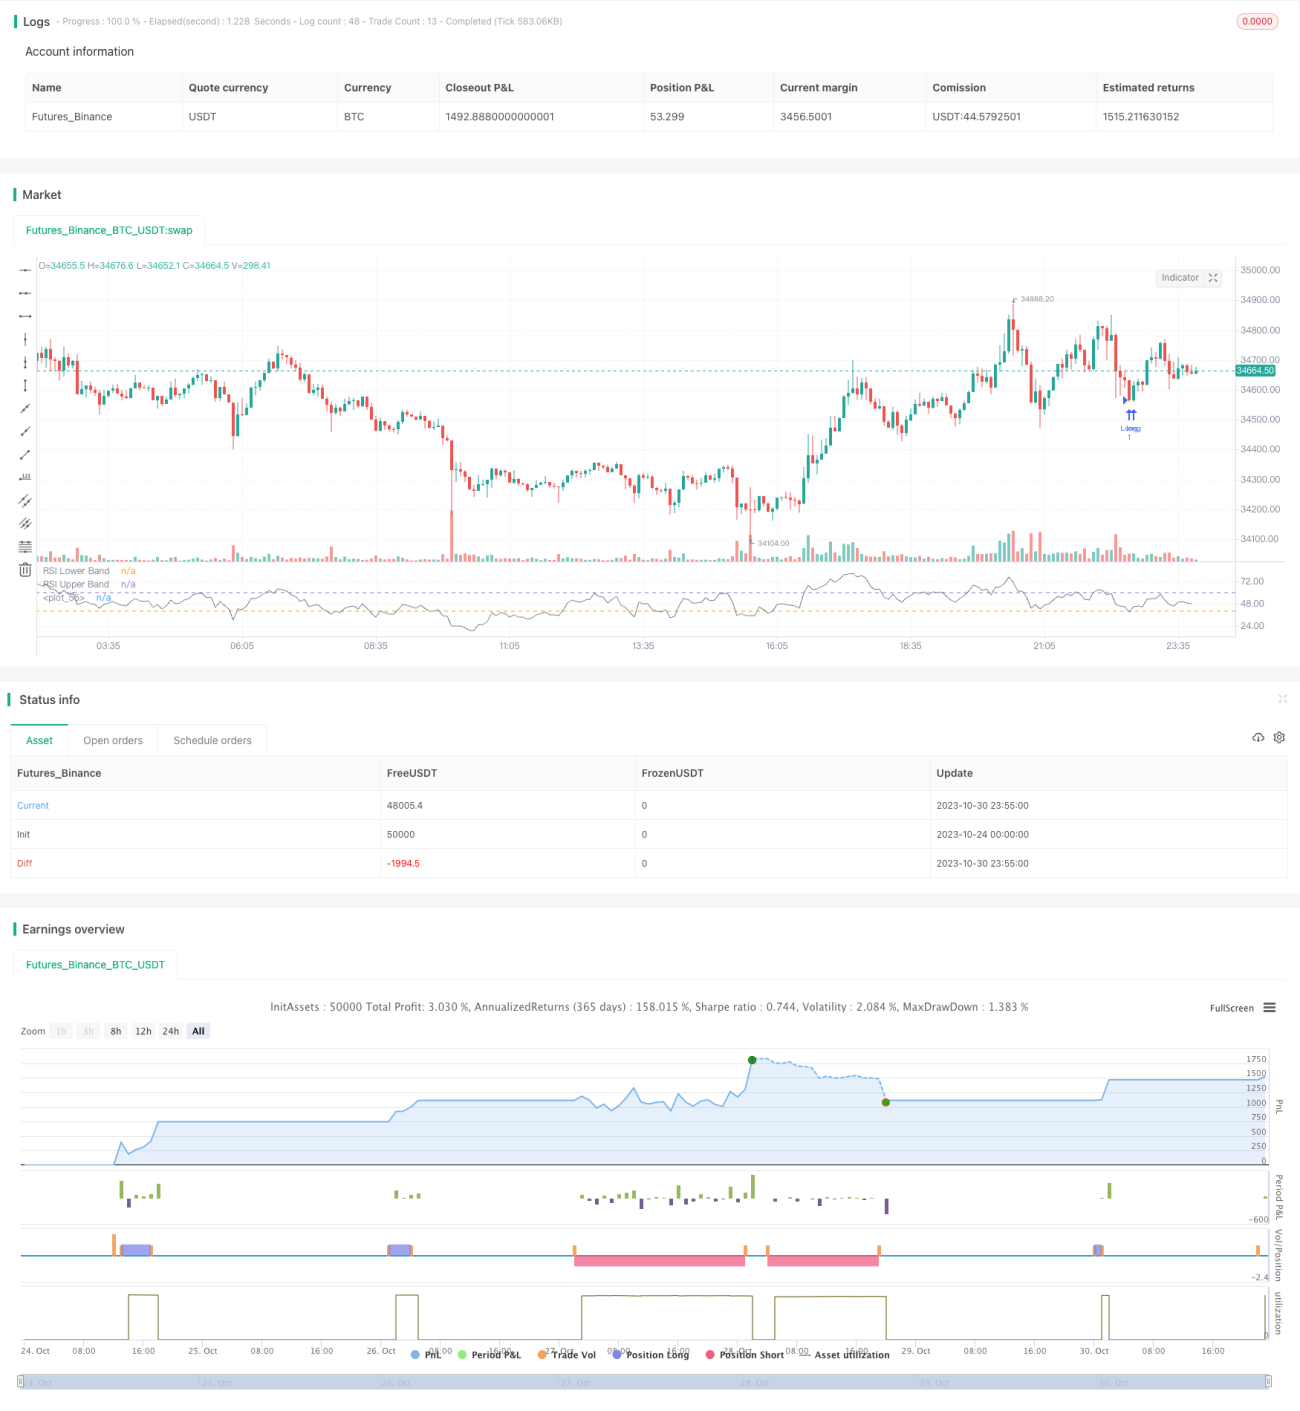
/*backtest
start: 2023-10-24 00:00:00
end: 2023-10-31 00:00:00
period: 5m
basePeriod: 1m
exchanges: [{"eid":"Futures_Binance","currency":"BTC_USDT"}]
*/

// This source code is subject to the terms of the Mozilla Public License 2.0 at https://mozilla.org/MPL/2.0/
// © Sarahann999
//@version=5
strategy("RSI Strategy", shorttitle="RSI", overlay= false)- 1