Dual Pressure Quantitative Trading Strategy

Author: ChaoZhang, Date: 2023-11-02 13:56:23
Tags:

img

Overview

The Dual Pressure quantitative trading strategy is a trend following strategy that combines Stochastic and volume indicators. It mainly uses the Stochastic K and D lines together with volume indicators to generate buy and sell signals, complemented by moving average crosses for additional signals.

Strategy Logic

Buy Signals

The main buy signal triggers when:

  1. Both K and D lines cross below oversold area (e.g. 20) and turn up, and both K and D are rising

  2. Volume is above a threshold (e.g. 1.4 times average volume)

  3. Close is above open (white candle)

Additional buy signals can come from:

  1. Golden cross: Fast EMA crosses above slow EMA, both rising

  2. Both K and D rise from low into middle zone (e.g. from below 20 to 20-80)

Sell Signals

Main sell signals trigger when:

  1. Both K and D enter overbought area (e.g. above 80)

  2. Death cross: Fast EMA crosses below slow EMA

  3. K crosses below D, and both K and D are falling

Stop Loss

A percentage (e.g. 6%) below buy price is set as stop loss level. Falling below triggers stop loss.

Advantage Analysis

  • Dual stochastic avoids false signals
  • Volume filters noise and ensures trend
  • Multiple signals combined improve accuracy
  • Moving averages assist overall trend
  • Stop loss controls risk

Advantage 1: Dual Stochastic Avoids False Signals

Single stochastic can generate many false signals. The dual stochastic combination filters false signals and improves reliability.

Advantage 2: Volume Filters Noise and Ensures Trend

The volume condition filters low volume non-trending spots and reduces risk of being trapped.

Advantage 3: Multiple Signals Improve Accuracy

Multiple indicators must align to trigger real trading signals. This improves signal reliability.

Advantage 4: Moving Averages Assist Overall Trend

Rules like dual moving averages ensure signals align with overall trend. This avoids counter-trend trades.

Advantage 5: Stop Loss Controls Risk

The stop loss logic realizes profits and controls loss on single trades.

Risk Analysis

  • Parameters need careful optimization, improper settings lead to poor performance
  • Stop loss placement must consider gap risk
  • Liquidity risk should be monitored for trading instruments
  • Lookback issue between different timeframes

Risk 1: Parameters Need Careful Optimization

The strategy has multiple parameters. They need optimization for different instruments, otherwise performance suffers.

Risk 2: Stop Loss Placement Must Consider Gap Risk

The stop loss point should account for price gapping scenarios. It should not be too close to buy price.

Risk 3: Monitor Liquidity Risk

For illiquid instruments, volume rules may filter too many signals. Volume thresholds need to be relaxed.

Risk 4: Lookback Issue Between Timeframes

Misalignment between signals on different timeframes may happen. Signals must be verified to match.

Enhancement Opportunities

The strategy can be enhanced in areas like:

  1. Optimize parameters for robustness

  2. Introduce machine learning for adaptive parameters

  3. Improve stop loss strategy to reduce stop loss rate

  4. Add filters to reduce trade frequency

  5. Explore conditional orders or profit taking to improve reward

Opportunity 1: Optimize Parameters for Robustness

Methods like genetic algorithms can systematically optimize parameters for stability across market regimes.

Opportunity 2: Introduce Machine Learning for Adaptive Parameters

Models can assess market conditions and adjust parameters accordingly, achieving dynamic optimization.

Opportunity 3: Improve Stop Loss Strategy to Reduce Stop Loss Rate

Better stop loss algorithms can reduce unnecessary stops while maintaining risk control.

Opportunity 4: Add Filters to Reduce Trade Frequency

Strengthening filters can reduce trade frequency, lower costs, and improve per trade returns.

Opportunity 5: Explore Conditional Orders or Profit Taking

According to market conditions, conditional orders or profit taking strategies can better maximize profit while controlling risk.

Conclusion

The strategy balances trend, risk control, costs and other aspects. The core advantages are dual stochastic plus volume for trend and stop loss for risk control. Next steps are to enhance robustness, adaptive parameters, stop loss optimization etc. to yield steady profits in more market regimes.
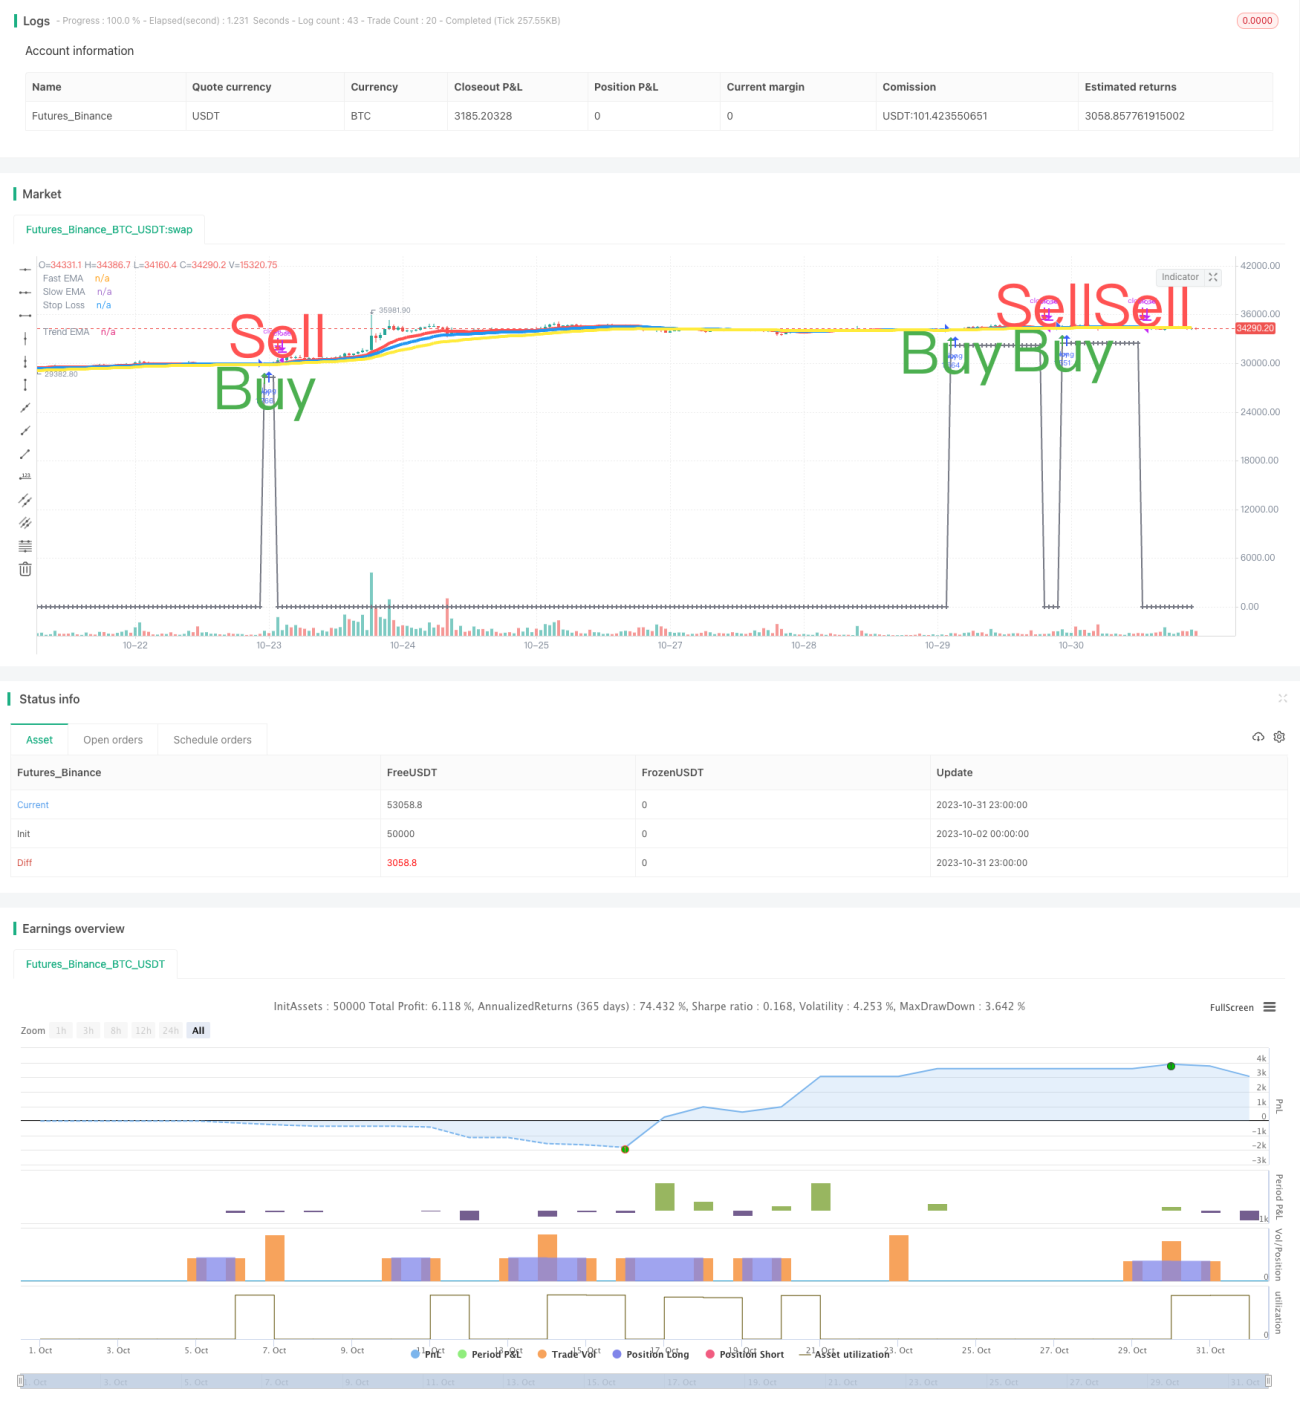

/*backtest
start: 2023-10-02 00:00:00
end: 2023-11-01 00:00:00
period: 1h
basePeriod: 15m
exchanges: [{"eid":"Futures_Binance","currency":"BTC_USDT"}]
*/

//@version=3
// SW SVE - Stochastic+Vol+EMAs [Sergio Waldoke]
// Script created by Sergio Waldoke (BETA VERSION v0.5, fine tuning PENDING)
// Stochastic process is the main source of signals, reinforced on buying by Volume. Also by Golden Cross.
// Selling is determined by K and D entering overselling zone or EMA's Death Cross signal, the first occurring,
// and some other signals combined.
// Buy Long when you see a long buy arrow.
// Sell when you see a close arrow.
// This is a version to be tuned and improved, but already showing excelent results after tune some parameters
// according to the kind of market.
// Strategy ready for doing backtests.

// SVE SYSTEM DESIGN:
// Buy Signal Trigger:
// - Both Stoch <= 20 crossing up and both growing and green candle and Vol/sma vol >= 1.40 Avg Vol
//   or
// - Both Stoch growing up and Vol/sma vol >= 1.40 Avg Vol and green candle and
//   both prior Stoch crossing up
//   or
//   [OPTIONAL]: (Bad for BTC 2018, excelent for 2017)
// - Crossingover(fast_ema, slow_ema) and growing(fast_ema) and growing(slow_ema) and green candle

// Exit position:
// - Both Stoch <= 20 and Both Stoch were > 20 during position
//   or
// - CrossingUnder(Fast EMA, Medium EMA)
//   or   [OPTIONAL] (Better for BTC 2018, Worse for BNB 1H)
// - CrossingUnder(k, d) and (k and d starting over over_buying) and (k and d descending) and k crossing down over_buying line

//calc_on_every_tick=true,
//calc_on_order_fills=true,   (affects historical calculation, triggers in middle of the bar, may be better for automatic orders)
strategy("SW SVE - Stochastic+Vol+EMAs [Sergio Waldoke]", shorttitle="SW SVE", overlay=true, max_bars_back=5000,
         default_qty_type=strategy.percent_of_equity, default_qty_value=100, currency="USD",
         commission_type=strategy.commission.percent, commission_value=0.25)

//Strategy Parameters
FromDay   = input(defval = 1, title = "From Day", minval = 1, maxval = 31)
FromMonth = input(defval = 1, title = "From Month", minval = 1, maxval = 12)
FromYear  = input(defval = 2018, title = "From Year", minval = 2009, maxval = 2200)
ToDay     = input(defval = 31, title = "To Day", minval = 1, maxval = 31)
ToMonth   = input(defval = 12, title = "To Month", minval = 1, maxval = 12)
ToYear    = input(defval = 2030, title = "To Year", minval = 2009, maxval = 2200)

//Indicator Parameters
//Original defaults for 4HS: 14, 3, 80, 20,   14, 23, 40,   20, 40,   3:
stoch_k = input(title="Stoch K",  defval=14, minval=1)
stoch_d = input(title="Stoch D",  defval=3, minval=1)
over_buying  = input(title="Stoch Overbuying Zone",  defval=80, minval=0, maxval=100)
over_selling = input(title="Stoch Overselling Zone",  defval=20, minval=0, maxval=100)

fast_ema_periods = input(title="Fast EMA (Death Cross)",  defval=14, minval=1, maxval=600)
slow_ema_periods = input(title="Slow EMA (Death Cross)",  defval=23, minval=1, maxval=600)
trend_ema_periods = input(title="Slowest EMA (Trend Test)",  defval=40, minval=1, maxval=600)

volume_periods = input(title="Volume Periods",  defval=20, minval=1, maxval=600)
volume_factor = input(title="Min Volume/Media Increase (%)",  defval=80, minval=-100) / 100 + 1

threshold_sl_perc = input(title="[Sell Trigger] Stop Loss Threshold %", defval=6.0, type=float, minval=0, maxval=100)

//before_buy = input(title="# Growing Before Buy",  defval=2, minval=1)
//before_sell = input(title="# Decreasing Before Sell",  defval=1, minval=1)
//stepsignal = input(title="Show White Steps", type=bool, defval=true)
//steps_base = input(title="White Steps Base",  defval=242, minval=0)

//Signals
fast_ema = ema(close, fast_ema_periods)
slow_ema = ema(close, slow_ema_periods)
trend_ema = ema(close, trend_ema_periods)
k = stoch(close, high, low, stoch_k)
d = sma(k, stoch_d)
vol_ma = sma(volume, volume_periods)

//REVIEW CONSTANT 1.75:
in_middle_zone(a) => a > over_selling * 1.75 and a < over_buying
growing(a) => a > a[1] 

was_in_middle_zone = k == d
was_in_middle_zone := was_in_middle_zone[1] or in_middle_zone(k) and in_middle_zone(d)

//Buy Signal Trigger:
//- Both Stoch <= 20 crossing up and both growing and 
//  green candle and Vol/sma vol >= 1.40 Avg Vol
buy = k <= over_selling and d <= over_selling and crossover(k, d) and growing(k) and growing(d) and
      close > open and volume/vol_ma >= volume_factor

//or
//- Both Stoch growing up and Vol/sma vol >= 1.40 Avg Vol and green candle and
//  both prior Stoch crossing up
buy := buy or (growing(k) and growing(d) and volume/vol_ma >= volume_factor and close > open and
              crossover(k[1], d[1]) )
//Worse:
//              (crossover(k[1], d[1]) or (crossover(k, d) and k[1] <= over_selling and d[1] <= over_selling) ) )

//or
//  [OPTIONAL]: (Bad for BTC 2018, excelent for 2017)
//- Crossingover(fast_ema, slow_ema) and growing(fast_ema) and growing(slow_ema) and green candle
buy := buy or (crossover(fast_ema, slow_ema) and growing(fast_ema) and growing(slow_ema) and close > open)


//Debug:
//d1 = close > open  ? 400 : 0
//plot(d1+5200, color=white, linewidth = 3, style = stepline)

//Exit position:
//- Both Stoch <= 20 and Both Stoch were > 20 during position
sell = k <= over_selling and d <= over_selling and was_in_middle_zone

//  or
//- CrossingUnder(Fast EMA, Medium EMA)
sell := sell or crossunder(fast_ema, slow_ema)

//  or  [OPTIONAL] (Better for BTC 2018, Worse for BNB 1H)
//- CrossingUnder(k, d) and (k and d starting over over_buying) and (k and d descending) and k crossing down over_buying line
sell := sell or (crossunder(k, d) and k[1] >= over_buying and d[1] >= over_buying and
                 not growing(k) and not growing(d) and k <= over_buying)

color = buy ? green : red

bought_price = close
bought_price := nz(bought_price[1])

already_bought = false
already_bought := nz(already_bought[1], false)

//Date Ranges
buy  := buy and  not already_bought


//d1 = buy ? 400 : 0
//plot(d1+6500, color=white, linewidth = 3, style = stepline)

was_in_middle_zone := (not buy and was_in_middle_zone) or (in_middle_zone(k) and in_middle_zone(d))

already_bought   := already_bought[1] or buy
bought_price := buy ? close * (1 - threshold_sl_perc/100) : bought_price[1]
trigger_SL = close < bought_price[0]
sell := sell or trigger_SL

sell := sell and  
                 already_bought and not buy and (was_in_middle_zone or trigger_SL)

//plot((sell?400:0)+5200, title="Buy-Sell", color=yellow, linewidth = 3, style = stepline)
                 
already_bought   := already_bought[0] and not sell
bought_price := sell ? 0 : bought_price[0]

//plot((was_in_middle_zone?400:0)+5200, title="Buy-Sell", color=yellow, linewidth = 3, style = stepline)

was_in_middle_zone := not sell and was_in_middle_zone

//Plot signals
plot(fast_ema, title="Fast EMA", color=red, linewidth = 4)
plot(slow_ema, title="Slow EMA", color=blue, linewidth = 4)
plot(trend_ema, title="Trend EMA", color=yellow, linewidth = 4)

//Stop Loss
plot(bought_price, color=gray, linewidth=2, style=cross, join=true, title="Stop Loss")

//Y = stepsignal ? lowest(40) : na
//Y = steps_base
//plot(mysignal+Y, title="Steps", color=white, linewidth = 3, style = stepline)
//Unit steps - for debugging
//plot(mysteps+Y, title="Steps2", color=yellow, linewidth = 3, style = stepline)

//Bought or not - for debugging
//plot((already_bought?400:0)+5200, title="Buy-Sell", color=yellow, linewidth = 3, style = stepline)
//plot((sell?400:0)+5200, title="Buy-Sell", color=yellow, linewidth = 3, style = stepline)

plotshape(buy, title="Buy arrows", style=shape.arrowup, location=location.belowbar, color=color, text="Buy", textcolor=color, size=size.huge, transp=30)
plotshape(sell, title="Sell arrows", style=shape.arrowdown, location=location.abovebar, color=color, text="Sell", textcolor=color, size=size.huge, transp=30)

//if n>2000
strategy.entry("buy", strategy.long, when=buy)
strategy.close_all(when=sell)

//plot(strategy.equity, title="Equity", color=white, linewidth = 4, style = line)

//AlertS trigger
//msg = "[SW Magic Signals EMA] BUY/SELL Signal has been triggered." + "(" + tostring(fastema) + ", " + tostring(slowema) + ") on " + tickerid + ", " + period + "."
msg = "SW SVE BUY/SELL Signal has been triggered. (#, #) on EXCH:PAIR, period: #."

alertcondition(buy or sell, title="SW SVE (BUY/SELL SIGNAL)", message=msg)
alertcondition(buy, title="SW SVE (BUY SIGNAL)", message=msg)
alertcondition(sell, title="SW SVE (SELL SIGNAL)", message=msg)


More