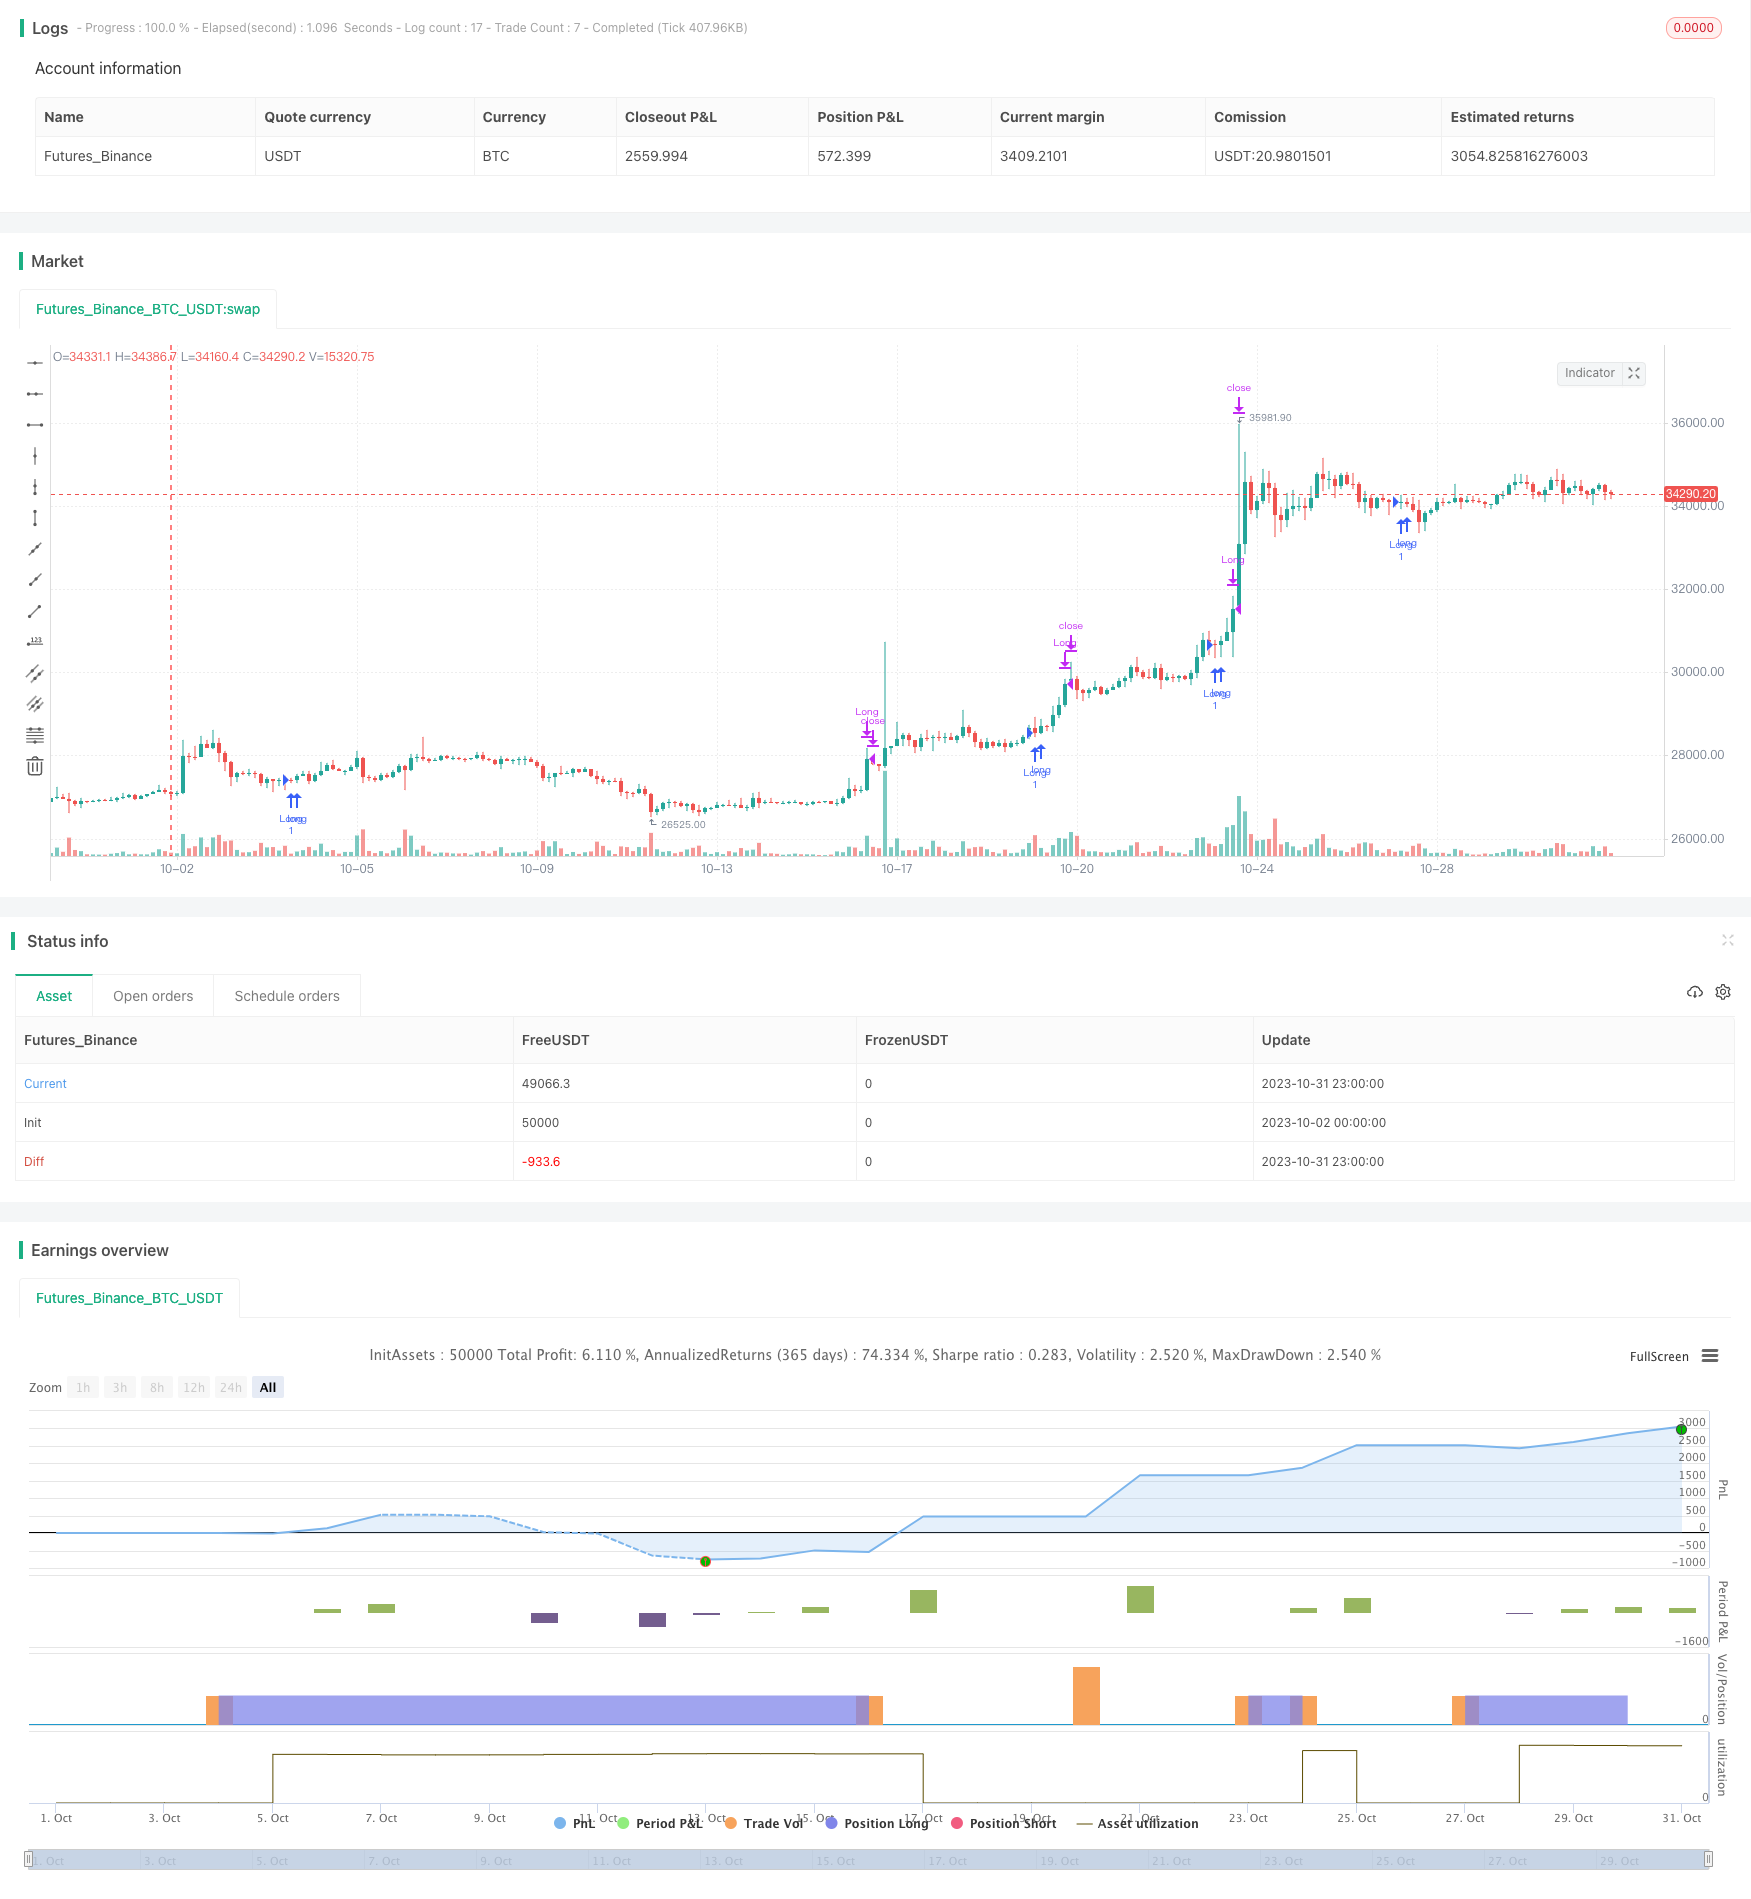
概述
RSI敢死队融合策略是一种结合RSI指标、一目均衡表指标和200日移动平均线的融合策略。该策略利用RSI指标识别多头或空头敢死队形态,一目均衡表指标判断趋势方向,200日移动平均线作为支撑和阻力辅助判断,在获多个指标确认之后进行交易信号的产生。
策略原理
首先,该策略使用RSI指标识别多头或空头敢死队形态。RSI敢死队形态是指股价创新高但RSI没有创新高的空头敢死队,或者股价创新低但RSI没有创新低的多头敢死队。这种形态通常预示着股价反转的来临。
其次,该策略利用一目均衡表指标中的先行线1和先行线2判断趋势方向。当先行线1在先行线2之上时认为处于上升趋势,反之则为下降趋势。一目均衡表指标通过转换线、基准线和延迟线的组合判断趋势方向,是一种较为可靠的趋势判断工具。
最后,该策略还引入200日移动平均线。移动平均线常被视为重要的支撑或阻力位。当一目均衡表处于上升趋势而价格站上200日线时,为多头信号。反之,当一目均衡表处于下降趋势而价格跌破200日线时,为空头信号。
综合多个指标的判断,可以过滤掉一些假信号,使交易决策更加可靠。当RSI形成敢死队,一目均衡表判断趋势方向,价格与200日线关系符合预期时,该策略才会产生实际的交易信号。
策略优势
这种多指标融合策略最大的优势在于可以过滤假信号,使交易决策更加可靠。
首先,RSI敢死队本身就具有一定的预测能力,可以提前观测到价格可能的反转。但仅凭RSI敢死队形态还不足以确定交易信号。
其次,引入一目均衡表指标可以更好判断趋势方向,避免在震荡行情中产生错误信号。一目均衡表中的先行线组合,对趋势判断非常有效。
最后,200日移动平均线的支持阻力作用也有助于进一步确认信号的可靠性。只有当一目均衡表确认趋势,价格又与200日线关系合适时,才产生交易信号。
综上,这种多指标融合策略,可以屏蔽掉大量假信号,只在多个指标达成共识时才产生实际信号,从而提高交易决策的准确性。这是该策略最大的优势所在。
策略风险
尽管多指标融合策略有助于提高信号质量,但该策略也存在一定的风险需要注意。
首先,多指标组合策略在一定程度上会漏过一些单一指标就可以捕捉到的机会。过于保守可能导致信号产生不足。
其次,不同指标之间可能会出现分歧和冲突。例如RSI显示敢死队形态,但一目均衡表的趋势判断又与之相反。这时该如何权衡多个指标也是一个难点。
再者,参数设置也会对策略产生较大影响。移动平均线周期、RSI参数等设置不当都可能导致策略效果大打折扣。
最后, codes之间的优化还有很大提升空间。可以引入机器学习算法来动态优化参数设置。也可以测试更多指标,寻找更优的组合方式。
总体来说,这种策略最大的风险在于复杂度提高,多指标组合优化难度增加。需要针对不同市场环境不断测试和优化,才能发挥策略的最大效用。
策略优化
该策略还有几个可优化的方向:
测试不同的指标参数设置,优化参数。移动平均线周期、RSI参数等都可以进行测试,找到最优参数组合。
尝试引入其他指标,如MACD、布林带等,丰富多指标组合,找到更好的指标搭配方式。
利用机器学习算法实现参数动态优化。根据不同市场环境,让策略自动优化参数设置。
增加止损策略,以控制交易风险。当价格突破支持或阻力位时,考虑止损退出。
优化策略的入场机会。可以通过降低过滤标准来获得更多机会,但需要衡量风险收益平衡。
根据回测结果优化代码,减少资源占用,提高策略效率。
探索更复杂的多指标关系,寻找更强的组合信号。引入更多条件和规则,但要注意过度优化的风险。
总结
RSI敢死队融合策略通过组合多个指标进行交易决策,可以有效过滤噪音信号,提高信号质量。该策略主要优势在于多指标确认机制,可以减少假信号,但也存在一定复杂度增加的问题。未来仍有很大的优化空间,特别是参数优化和指标组合优化方面。总体来说,这是一种相对保守可靠的交易策略思路,值得进一步探索研究。
/*backtest
start: 2023-10-02 00:00:00
end: 2023-11-01 00:00:00
period: 3h
basePeriod: 15m
exchanges: [{"eid":"Futures_Binance","currency":"BTC_USDT"}]
*/

// This source code is subject to the terms of the Mozilla Public License 2.0 at https://mozilla.org/MPL/2.0/
// © tradethrills

//@version=4
strategy("RSI Divergence X Ichimoku Cloud X 200EMA", overlay=true)

//RSI Indicator
len = input(defval=14, minval=1)
src = input(defval=close)
lbR = input(defval=5)
lbL = input(defval=5)
takeProfitLevellong = input(minval = 70, defval = 75)
takeProfitLevelshort = input(minval = 30, defval = 25)

rangeUpper = input(defval=60)
rangeLower = input(defval=5)

//200 EMA
ema200 = ema(close, 200)

//Ichimoku Cloud Indicator
conversionPeriods = input(9, minval=1)
basePeriods = input(26, minval=1)
laggingSpan2Periods = input(52, minval=1)
displacement = input(26, minval=1)

donchian(len) => avg(lowest(len), highest(len))

conversionLine = donchian(conversionPeriods)
baseLine = donchian(basePeriods)
leadLine1 = avg(conversionLine, baseLine)
leadLine2 = donchian(laggingSpan2Periods)

abovecloud =  max(leadLine1, leadLine2)
belowcloud = min(leadLine1, leadLine2)

//RSI Divergence Strategy

osc = rsi(src, len)
_inrange(cond) =>
    bars = barssince(cond == true)
    rangeLower <= bars and bars <= rangeUpper

pricelowfound = na(pivotlow(osc, lbL, lbR)) ? false : true
pricehighfound = na(pivothigh(osc, lbL, lbR)) ? false : true

//Regular Bullish
osc_higherlow = osc[lbR] > valuewhen(pricelowfound, osc[lbR], 1) and _inrange(pricelowfound[1])
price_lowerlow = low[lbR] < valuewhen(pricelowfound, low[lbR], 1)

bullCond = price_lowerlow and osc_higherlow and pricelowfound

//Hidden Bullish
osc_lowerlow = osc[lbR] < valuewhen(pricelowfound, osc[lbR], 1) and _inrange(pricelowfound[1])
price_higherlow = low[lbR] > valuewhen(pricelowfound, low[lbR], 1)

hiddenbullCond = price_higherlow and osc_lowerlow and pricelowfound

//Regular Bearish
osc_lowerhigh = osc[lbR] < valuewhen(pricehighfound, osc[lbR], 1) and _inrange(pricehighfound[1])
price_higherhigh = high[lbR] > valuewhen(pricehighfound, high[lbR], 1)

bearCond = price_higherhigh and osc_lowerhigh and pricehighfound

//Hidden Bearish
osc_higherhigh = osc[lbR] > valuewhen(pricehighfound, osc[lbR], 1) and _inrange(pricehighfound[1])
price_lowerhigh = high[lbR] < valuewhen(pricehighfound, high[lbR], 1)

hiddenbearCond = price_lowerhigh and osc_higherhigh and pricehighfound

//Entry and Exit
longCondition = (bullCond or hiddenbullCond) and (abovecloud > ema200)
closelongCondition = crossover(osc, takeProfitLevellong)

shortCondition = (bearCond or hiddenbearCond) and (ema200 > belowcloud)
closeshortCondition = crossover(osc, takeProfitLevelshort)

strategy.entry("Long", strategy.long,  when=longCondition)
strategy.close("Long", when=closelongCondition)

strategy.entry("Short", strategy.short,  when=shortCondition)
strategy.close("Short", when=closeshortCondition)